313 Peach Tree Ave Vacaville, CA 95688
Estimated Value: $458,000 - $613,000
About This Home
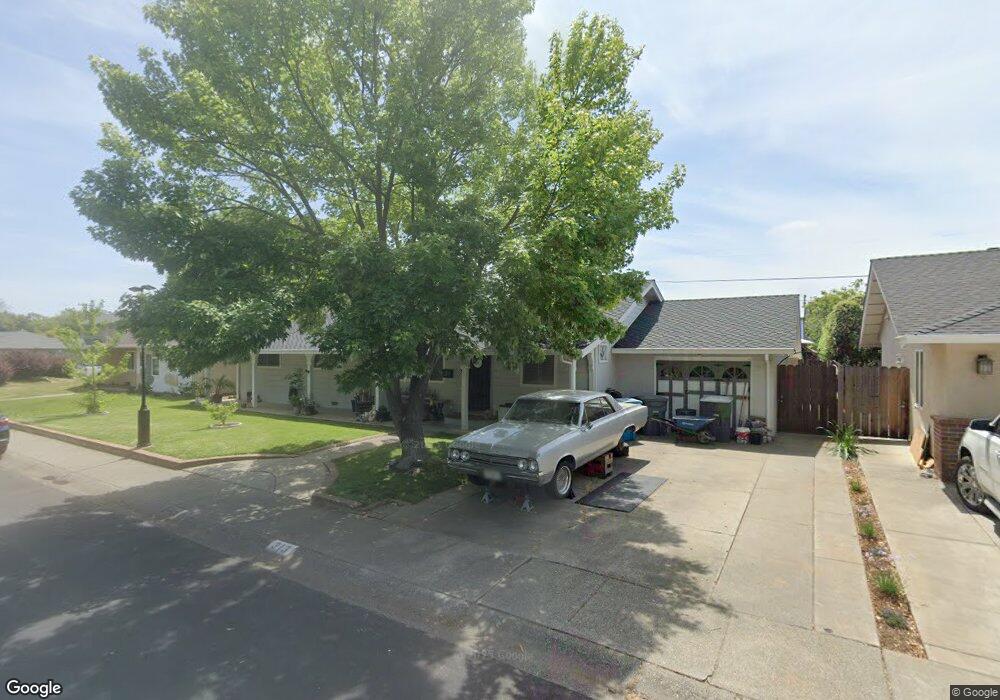
This home is located at 313 Peach Tree Ave, Vacaville, CA 95688 and is currently estimated at $551,370, approximately $293 per square foot. 313 Peach Tree Ave is a home located in Solano County with nearby schools including Alamo Elementary School, Orchard Elementary School, and Willis Jepson Middle School.
Ownership History
We collect this data history from publicly available records. To have your information removed, we recommend requesting removal directly through your county’s website.
Purchase Details
Purchase Details
Home Financials for this Owner
Home Financials are based on the most recent Mortgage that was taken out on this home.Purchase History
We collect this data history from publicly available records. To have your information removed, we recommend requesting removal directly through your county’s website.
| Date | Buyer | Sale Price | Title Company |
|---|---|---|---|
| -- | None Available | ||
| $155,000 | Frontier Title Company |
Mortgage History
We collect this data history from publicly available records. To have your information removed, we recommend requesting removal directly through your county’s website.
| Date | Status | Borrower | Loan Amount |
|---|---|---|---|
| Closed | $139,500 |
Tax History
We collect this data history from publicly available records. To have your information removed, we recommend requesting removal directly through your county’s website.
| Year | Tax Paid | Tax Assessment Tax Assessment Total Assessment is a certain percentage of the fair market value that is determined by local assessors to be the total taxable value of land and additions on the property. | Land | Improvement |
|---|---|---|---|---|
| 2025 | $3,387 | $301,283 | $50,389 | $250,894 |
| 2024 | $3,387 | $295,376 | $49,401 | $245,975 |
| 2023 | $3,306 | $289,585 | $48,433 | $241,152 |
| 2022 | $3,218 | $283,908 | $47,484 | $236,424 |
| 2021 | $3,223 | $278,342 | $46,553 | $231,789 |
| 2020 | $3,179 | $275,489 | $46,076 | $229,413 |
| 2019 | $3,123 | $270,088 | $45,173 | $224,915 |
| 2018 | $2,735 | $235,316 | $44,288 | $191,028 |
| 2017 | $2,643 | $230,703 | $43,420 | $187,283 |
| 2016 | $2,624 | $226,180 | $42,569 | $183,611 |
| 2015 | $2,589 | $222,783 | $41,930 | $180,853 |
| 2014 | $2,424 | $218,420 | $41,109 | $177,311 |
Map
- 306 Buck Ave
- 432 S Orchard Ave
- 149 Mason St
- 0 Merchant St Unit 325089259
- 125 Kendal St
- 58 Cernon St
- 0 Parker St Unit 324045416
- 490 Edgewood Dr Unit 23
- 490 Edgewood Dr Unit 5
- 477 Meadowview Ct
- 620 Walnut Ave
- 451 Alamo Dr
- 0 Boyd St Unit 326023620
- 449 Cottonwood St
- 142 Hillview Dr
- 456 Deodara St
- 257 Cedar St
- 512 Davis St
- 317 Grape St
- 341 Grape St
- 297 Peach Tree Ave
- 285 Peach Tree Ave
- 280 Magnolia Ave
- 301 Peach Tree Ave
- 270 Magnolia Ave
- 371 Chestnut St
- 273 Peach Tree Ave
- 300 Magnolia Ave
- 260 Magnolia Ave
- 261 Peach Tree Ave
- 310 Magnolia Ave
- 362 Chestnut St
- 280 Peach Tree Ave
- 250 Magnolia Ave
- 281 Magnolia Ave
- 271 Magnolia Ave
- 351 Chestnut St
- 260 Peach Tree Ave
- 301 Magnolia Ave
- 261 Magnolia Ave
Ask me questions while you tour the home.