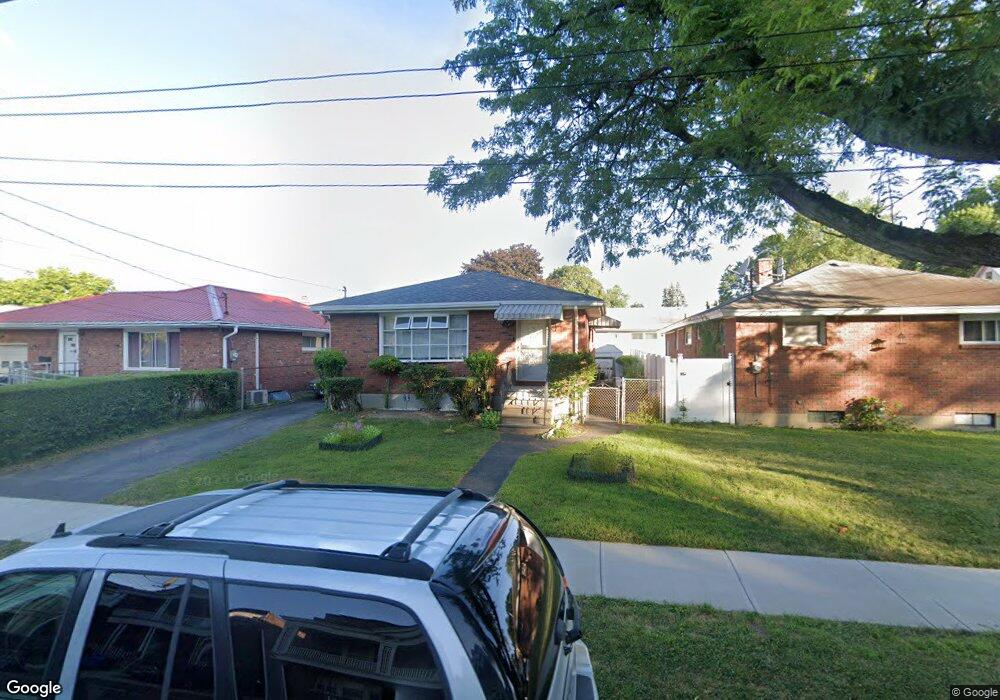
313 Quail St Albany, NY 12208
Pine Hills NeighborhoodEstimated Value: $245,000 - $265,000
3
Beds
2
Baths
1,134
Sq Ft
$226/Sq Ft
Est. Value
About This Home
This home is located at 313 Quail St, Albany, NY 12208 and is currently estimated at $256,362, approximately $226 per square foot. 313 Quail St is a home located in Albany County with nearby schools including New Scotland Elementary School, William S Hackett Middle School, and Albany High School.
Ownership History
Date
Name
Owned For
Owner Type
Purchase Details
Closed on
Dec 27, 2011
Sold by
Everett Melvin L and Everett Dennis
Bought by
Everett Dennis
Current Estimated Value
Purchase Details
Closed on
Feb 10, 2007
Sold by
Everett Otha
Bought by
Everett Nelvin L and Everett Dennis
Purchase Details
Closed on
Feb 5, 2007
Sold by
Everett Otha
Bought by
Everett Melvin
Create a Home Valuation Report for This Property
The Home Valuation Report is an in-depth analysis detailing your home's value as well as a comparison with similar homes in the area
Home Values in the Area
Average Home Value in this Area
Purchase History
| Date | Buyer | Sale Price | Title Company |
|---|---|---|---|
| Everett Dennis | -- | None Available | |
| Everett Nelvin L | -- | None Available | |
| Everett Melvin | -- | -- |
Source: Public Records
Tax History Compared to Growth
Tax History
| Year | Tax Paid | Tax Assessment Tax Assessment Total Assessment is a certain percentage of the fair market value that is determined by local assessors to be the total taxable value of land and additions on the property. | Land | Improvement |
|---|---|---|---|---|
| 2024 | $5,292 | $222,000 | $44,000 | $178,000 |
| 2023 | $4,059 | $114,000 | $22,800 | $91,200 |
| 2022 | $3,893 | $114,000 | $22,800 | $91,200 |
| 2021 | $3,859 | $114,000 | $22,800 | $91,200 |
| 2020 | $3,688 | $114,000 | $22,800 | $91,200 |
| 2019 | $4,488 | $114,000 | $22,800 | $91,200 |
| 2018 | $3,686 | $114,000 | $22,800 | $91,200 |
| 2017 | $1,655 | $114,000 | $22,800 | $91,200 |
| 2016 | $3,580 | $114,000 | $22,800 | $91,200 |
| 2015 | $3,385 | $109,800 | $22,000 | $87,800 |
| 2014 | -- | $109,800 | $22,000 | $87,800 |
Source: Public Records
Map
Nearby Homes
- 320 Quail St
- 302 Quail St
- 645 Myrtle Ave
- 561 Park Ave
- 661 Myrtle Ave
- 576 Providence St
- 538 Park Ave
- 407 Ontario St
- 538 Myrtle Ave
- 495 Morris St
- 672 Providence St
- 685 Myrtle Ave
- 687 Myrtle Ave
- 514 Morris St
- 800 Madison Ave
- 824 Madison Ave
- 113 S Lake Ave
- 72 Woodlawn Ave
- 155 Woodlawn Ave
- 866 Madison Ave