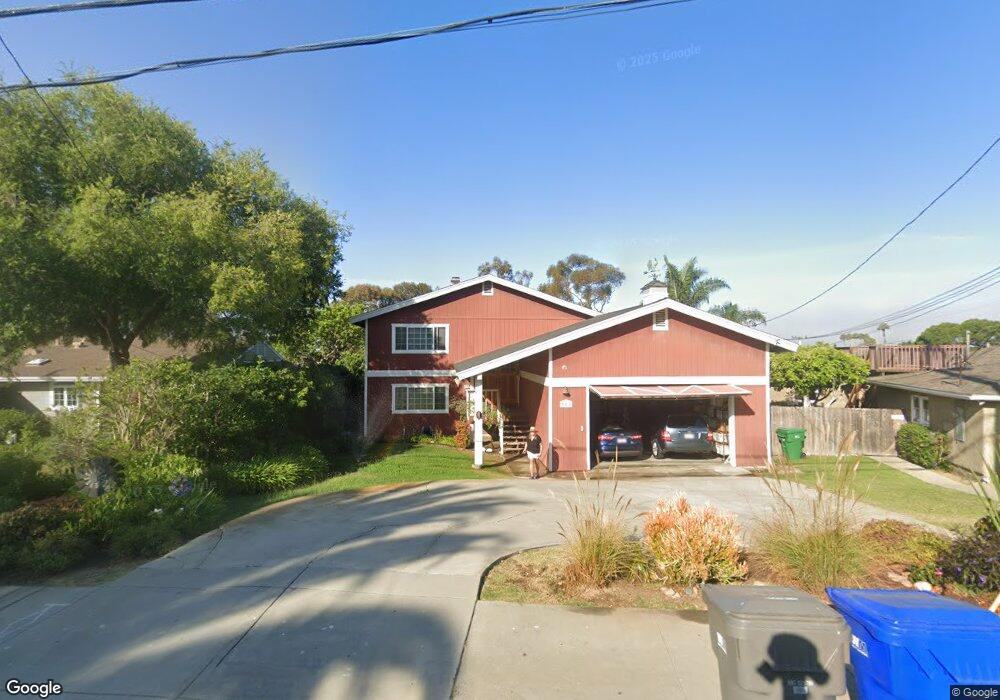
313 S Barnwell St Oceanside, CA 92054
Loma Alta NeighborhoodEstimated Value: $1,052,000 - $1,375,000
About This Home
This home is located at 313 S Barnwell St, Oceanside, CA 92054 and is currently estimated at $1,220,924, approximately $458 per square foot. 313 S Barnwell St is a home located in San Diego County with nearby schools including Lincoln Middle School, Oceanside High School, and Oceanside Adventist Elementary School.
Ownership History
We collect this data history from publicly available records. To have your information removed, we recommend requesting removal directly through your county’s website.
Purchase Details
Purchase Details
Home Financials for this Owner
Home Financials are based on the most recent Mortgage that was taken out on this home.Purchase Details
Home Values in the Area
Average Home Value in this Area
Purchase History
We collect this data history from publicly available records. To have your information removed, we recommend requesting removal directly through your county’s website.
| Date | Buyer | Sale Price | Title Company |
|---|---|---|---|
| -- | None Listed On Document | ||
| $225,000 | First American Title | ||
| $155,000 | -- |
Mortgage History
We collect this data history from publicly available records. To have your information removed, we recommend requesting removal directly through your county’s website.
| Date | Status | Borrower | Loan Amount |
|---|---|---|---|
| Previous Owner | $180,000 |
Tax History
We collect this data history from publicly available records. To have your information removed, we recommend requesting removal directly through your county’s website.
| Year | Tax Paid | Tax Assessment Tax Assessment Total Assessment is a certain percentage of the fair market value that is determined by local assessors to be the total taxable value of land and additions on the property. | Land | Improvement |
|---|---|---|---|---|
| 2025 | $3,872 | $355,660 | $78,008 | $277,652 |
| 2024 | $3,872 | $348,687 | $76,479 | $272,208 |
| 2023 | $3,751 | $341,851 | $74,980 | $266,871 |
| 2022 | $3,693 | $335,149 | $73,510 | $261,639 |
| 2021 | $3,706 | $328,578 | $72,069 | $256,509 |
| 2020 | $3,591 | $325,210 | $71,331 | $253,879 |
| 2019 | $3,486 | $318,834 | $69,933 | $248,901 |
| 2018 | $3,448 | $312,583 | $68,562 | $244,021 |
| 2017 | $3,383 | $306,455 | $67,218 | $239,237 |
| 2016 | $3,272 | $300,447 | $65,900 | $234,547 |
| 2015 | $3,176 | $295,935 | $64,911 | $231,024 |
| 2014 | $3,053 | $290,139 | $63,640 | $226,499 |
Map
- 230 Hoover St
- 2833 Turnbull St
- 2638 Lancelot Dr
- 2904 E Barnwell St
- 403 Foussat Rd
- 2861 Turnbull St
- 2721 Lomita St
- 327 Islander St
- 2937 E Barnwell St
- 506 Canyon Dr Unit 58
- 506 Canyon Dr Unit 6
- 0 Pahvant St
- 223 Cottingham Ct
- 2118 Oceanside Blvd
- 432 Edgehill Ln Unit 169
- 432 Edgehill Ln Unit 165
- 432 Edgehill Ln Unit 95
- 432 Edgehill Ln Unit 157
- 432 Edgehill Ln Unit 79
- 432 Edgehill Ln Unit 116
Ask me questions while you tour the home.