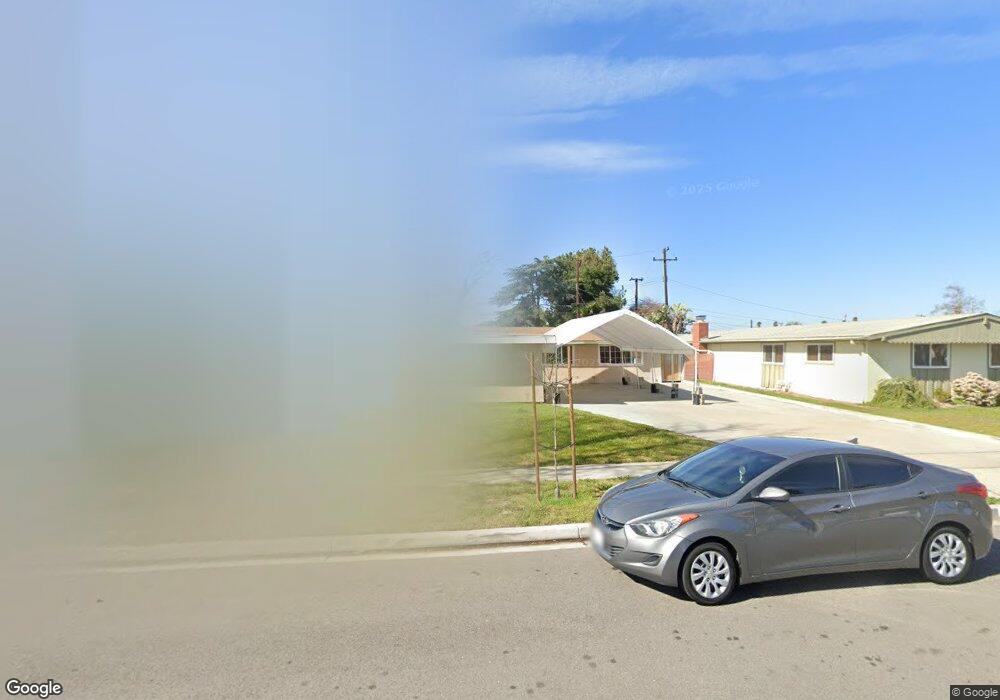
313 S Broder St Anaheim, CA 92804
West Anaheim NeighborhoodEstimated Value: $873,912 - $941,000
3
Beds
2
Baths
1,367
Sq Ft
$665/Sq Ft
Est. Value
About This Home
This home is located at 313 S Broder St, Anaheim, CA 92804 and is currently estimated at $908,478, approximately $664 per square foot. 313 S Broder St is a home located in Orange County with nearby schools including Dr. Albert Schweitzer Elementary School, Dale Jr High School, and Magnolia High.
Ownership History
Date
Name
Owned For
Owner Type
Purchase Details
Closed on
Jun 21, 2018
Sold by
Bui Cathy
Bought by
Bui Cathy Uyen and The Cathy Bui Trust
Current Estimated Value
Purchase Details
Closed on
Jul 20, 2009
Sold by
Deutsche Bank National Trust Company
Bought by
Bui Cathy
Purchase Details
Closed on
Jun 10, 2009
Sold by
Manning Jeffrey R and Manning Sheila A
Bought by
Deutsche Bank National Trust Company
Purchase Details
Closed on
Jul 7, 2000
Sold by
Kohler Keith A and Kohler Andrea
Bought by
Manning Jeffrey R and Manning Sheila A
Home Financials for this Owner
Home Financials are based on the most recent Mortgage that was taken out on this home.
Original Mortgage
$211,258
Interest Rate
8.2%
Mortgage Type
FHA
Purchase Details
Closed on
Nov 17, 1999
Sold by
Kohler Keith A and Kohler Andrea
Bought by
Kohler Keith A and Kohler Andrea
Home Financials for this Owner
Home Financials are based on the most recent Mortgage that was taken out on this home.
Original Mortgage
$80,000
Interest Rate
7.84%
Mortgage Type
Stand Alone First
Create a Home Valuation Report for This Property
The Home Valuation Report is an in-depth analysis detailing your home's value as well as a comparison with similar homes in the area
Home Values in the Area
Average Home Value in this Area
Purchase History
| Date | Buyer | Sale Price | Title Company |
|---|---|---|---|
| Bui Cathy Uyen | -- | None Available | |
| Bui Cathy | $282,000 | Lsi Title Company | |
| Bui Cathy | -- | Lsi Title Company | |
| Deutsche Bank National Trust Company | $466,925 | None Available | |
| Manning Jeffrey R | $213,000 | Fidelity National Title Ins | |
| Kohler Keith A | -- | American Title Co |
Source: Public Records
Mortgage History
| Date | Status | Borrower | Loan Amount |
|---|---|---|---|
| Previous Owner | Manning Jeffrey R | $211,258 | |
| Previous Owner | Kohler Keith A | $80,000 |
Source: Public Records
Tax History Compared to Growth
Tax History
| Year | Tax Paid | Tax Assessment Tax Assessment Total Assessment is a certain percentage of the fair market value that is determined by local assessors to be the total taxable value of land and additions on the property. | Land | Improvement |
|---|---|---|---|---|
| 2025 | $4,249 | $364,005 | $273,656 | $90,349 |
| 2024 | $4,249 | $356,868 | $268,290 | $88,578 |
| 2023 | $4,138 | $349,871 | $263,029 | $86,842 |
| 2022 | $4,097 | $343,011 | $257,871 | $85,140 |
| 2021 | $4,049 | $336,286 | $252,815 | $83,471 |
| 2020 | $4,026 | $332,838 | $250,222 | $82,616 |
| 2019 | $3,929 | $326,312 | $245,315 | $80,997 |
| 2018 | $3,881 | $319,914 | $240,505 | $79,409 |
| 2017 | $3,746 | $313,642 | $235,790 | $77,852 |
| 2016 | $3,728 | $307,493 | $231,167 | $76,326 |
| 2015 | $3,696 | $302,875 | $227,695 | $75,180 |
| 2014 | $3,514 | $296,943 | $223,235 | $73,708 |
Source: Public Records
Map
Nearby Homes
- 2945 W Bridgeport Ave
- 2942 W Floyd Ave
- 231 S Laxore St
- 103 S Laxore St
- 106 S Laxore St Unit 407
- 107 S Laxore St
- 211 S Beach Blvd Unit 92
- Plan Two at Mason
- Plan Four at Mason
- Plan Three at Mason
- Plan Seven at Mason
- 109 S Laxore St
- 235 S Beach Blvd Unit 132
- 2943 W Lincoln Ave
- 2770 W Lincoln Ave Unit 40
- 2770 W Lincoln Ave Unit 58
- 507 S Shields Dr
- 2871 W Tyler Ave
- 619 S Shields Dr
- 716 S Hayward St Unit 2
- 317 S Broder St
- 309 S Broder St
- 2935 W Skywood Cir
- 403 S Broder St
- 2928 W Academy Ave
- 303 S Broder St
- 2937 W Skywood Cir
- 2932 W Academy Ave
- 2934 W Skywood Cir
- 310 S Broder St
- 407 S Broder St
- 314 S Broder St
- 306 S Broder St
- 400 S Broder St
- 2936 W Academy Ave
- 302 S Broder St
- 2941 W Skywood Cir
- 404 S Broder St
- 411 S Broder St
- 2936 W Skywood Cir