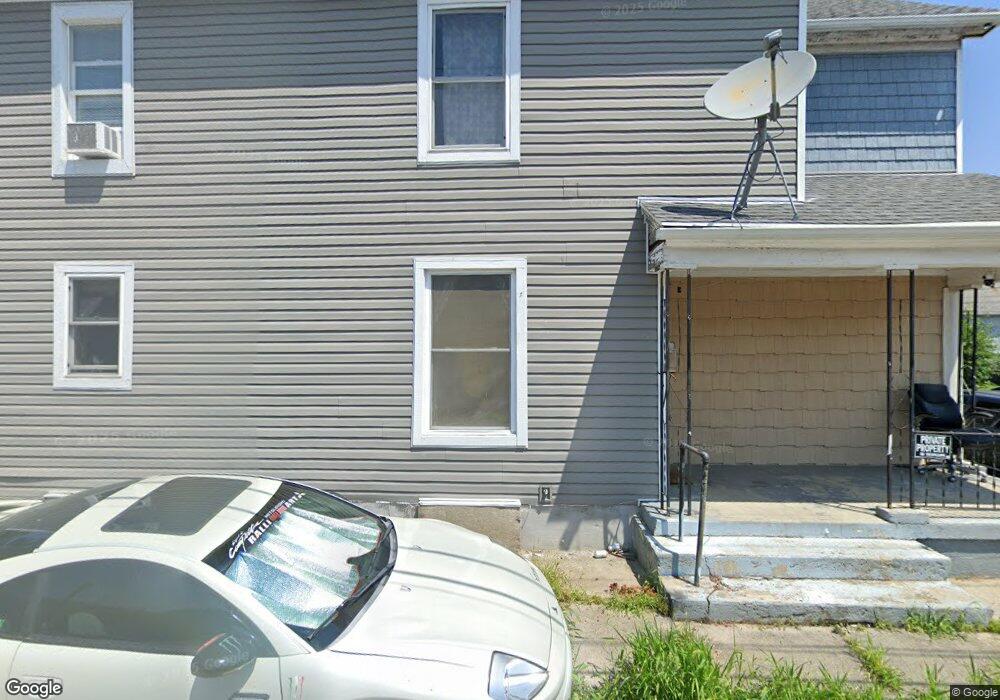
313 S Findlay St Dayton, OH 45403
Burkhardt NeighborhoodEstimated Value: $52,000 - $154,000
6
Beds
2
Baths
2,988
Sq Ft
$35/Sq Ft
Est. Value
About This Home
This home is located at 313 S Findlay St, Dayton, OH 45403 and is currently estimated at $105,771, approximately $35 per square foot. 313 S Findlay St is a home located in Montgomery County with nearby schools including Ruskin Elementary School, Kiser Elementary, and Horizon Science Academy Dayton Downtown.
Ownership History
Date
Name
Owned For
Owner Type
Purchase Details
Closed on
May 21, 2025
Sold by
Morocho Jose Aguayza and Lala Rosa
Bought by
Lala Lizeth Noemi Aguayz
Current Estimated Value
Purchase Details
Closed on
Nov 16, 2017
Sold by
Canavon Llc
Bought by
Morocho Jose Aguayza and Lala Rosa
Purchase Details
Closed on
Sep 7, 2016
Sold by
Ohio Mariner Estates Llc
Bought by
Canavon Llc
Purchase Details
Closed on
Jun 2, 2006
Sold by
Russ Joseph D
Bought by
Ohio Mariner Estates Llc
Home Financials for this Owner
Home Financials are based on the most recent Mortgage that was taken out on this home.
Original Mortgage
$31,500
Interest Rate
6.48%
Mortgage Type
Fannie Mae Freddie Mac
Purchase Details
Closed on
Apr 10, 2006
Sold by
Stebel Raymond F
Bought by
Russ Joseph D
Home Financials for this Owner
Home Financials are based on the most recent Mortgage that was taken out on this home.
Original Mortgage
$31,500
Interest Rate
6.48%
Mortgage Type
Fannie Mae Freddie Mac
Create a Home Valuation Report for This Property
The Home Valuation Report is an in-depth analysis detailing your home's value as well as a comparison with similar homes in the area
Home Values in the Area
Average Home Value in this Area
Purchase History
| Date | Buyer | Sale Price | Title Company |
|---|---|---|---|
| Lala Lizeth Noemi Aguayz | -- | First Central Land Title | |
| Morocho Jose Aguayza | $12,000 | None Available | |
| Canavon Llc | $20,000 | Home Services Title Llc | |
| Ohio Mariner Estates Llc | -- | None Available | |
| Russ Joseph D | $35,000 | None Available |
Source: Public Records
Mortgage History
| Date | Status | Borrower | Loan Amount |
|---|---|---|---|
| Previous Owner | Russ Joseph D | $31,500 |
Source: Public Records
Tax History Compared to Growth
Tax History
| Year | Tax Paid | Tax Assessment Tax Assessment Total Assessment is a certain percentage of the fair market value that is determined by local assessors to be the total taxable value of land and additions on the property. | Land | Improvement |
|---|---|---|---|---|
| 2024 | $1,183 | $19,970 | $1,560 | $18,410 |
| 2023 | $1,183 | $19,970 | $1,560 | $18,410 |
| 2022 | $1,331 | $17,450 | $1,370 | $16,080 |
| 2021 | $1,323 | $17,450 | $1,370 | $16,080 |
| 2020 | $1,321 | $17,450 | $1,370 | $16,080 |
| 2019 | $1,265 | $14,930 | $1,370 | $13,560 |
| 2018 | $1,267 | $14,930 | $1,370 | $13,560 |
| 2017 | $1,258 | $14,930 | $1,370 | $13,560 |
| 2016 | $1,454 | $15,600 | $1,370 | $14,230 |
| 2015 | $1,303 | $15,600 | $1,370 | $14,230 |
| 2014 | $1,303 | $15,600 | $1,370 | $14,230 |
| 2012 | -- | $21,200 | $2,600 | $18,600 |
Source: Public Records
Map
Nearby Homes
- 639 Huffman Ave
- 755 Huffman Ave
- 240 S Torrence St
- 240 Bierce Ave
- 241 Linden Ave
- 2341 E 5th St
- 2821 E 5th St Unit 2819
- 1018 Haviland Ave
- 1024 Haviland Ave
- 102 S Findlay St
- 2126 E 4th St
- 2929 E 5th St
- 2103 E 4th St
- 1609 Xenia Ave
- 57 S Torrence St
- 800 Linden Ave
- 40 Klee Ave
- 835 Lorain Ave
- 814 Lorain Ave
- 227 Livingston Ave Unit 225
- 632 Huffman Ave
- 636 Huffman Ave
- 628 Huffman Ave
- 624 Huffman Ave
- 704 Huffman Ave
- 27 Davis Ave
- 708 Huffman Ave
- 616 Huffman Ave
- 15 Davis Ave
- 11 Davis Ave
- 712 Huffman Ave
- 612 Huffman Ave
- 716 Huffman Ave
- 643 Huffman Ave
- 647 Huffman Ave
- 720 Huffman Ave
- 635 Huffman Ave
- 633 Huffman Ave
- 290 S Findlay St
- 400 Linden Ave