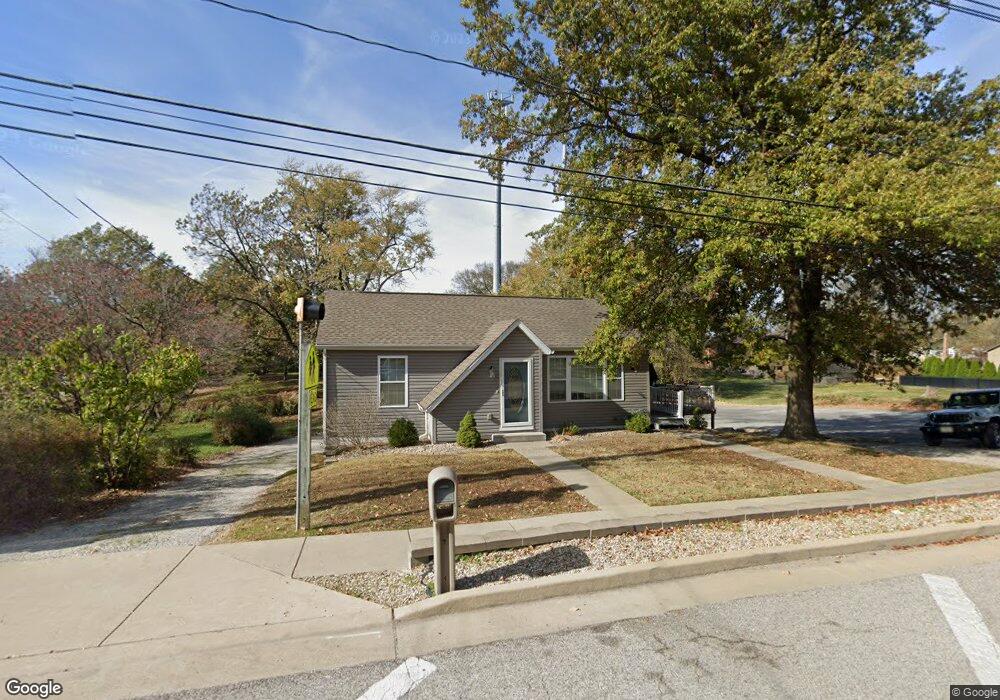
313 S Main St O Fallon, IL 62269
Estimated Value: $144,000 - $208,304
Studio
--
Bath
980
Sq Ft
$170/Sq Ft
Est. Value
About This Home
This home is located at 313 S Main St, O Fallon, IL 62269 and is currently estimated at $167,076, approximately $170 per square foot. 313 S Main St is a home located in St. Clair County with nearby schools including Shiloh Elementary School, Shiloh Middle School, and O'Fallon Township High School.
Ownership History
Date
Name
Owned For
Owner Type
Purchase Details
Closed on
Mar 28, 2025
Sold by
Manning Daniel and Manning David
Bought by
Manning Scott and Scott M Manning & Stephanie D Manning Re
Current Estimated Value
Home Financials for this Owner
Home Financials are based on the most recent Mortgage that was taken out on this home.
Original Mortgage
$135,000
Outstanding Balance
$134,424
Interest Rate
6.85%
Mortgage Type
New Conventional
Estimated Equity
$32,652
Purchase Details
Closed on
Jul 9, 1999
Bought by
Manning Richard
Create a Home Valuation Report for This Property
The Home Valuation Report is an in-depth analysis detailing your home's value as well as a comparison with similar homes in the area
Home Values in the Area
Average Home Value in this Area
Purchase History
| Date | Buyer | Sale Price | Title Company |
|---|---|---|---|
| Manning Scott | $150,000 | Advanced Title Solutions | |
| Manning Richard | $68,000 | -- |
Source: Public Records
Mortgage History
| Date | Status | Borrower | Loan Amount |
|---|---|---|---|
| Open | Manning Scott | $135,000 |
Source: Public Records
Tax History
| Year | Tax Paid | Tax Assessment Tax Assessment Total Assessment is a certain percentage of the fair market value that is determined by local assessors to be the total taxable value of land and additions on the property. | Land | Improvement |
|---|---|---|---|---|
| 2024 | $2,834 | $44,223 | $6,337 | $37,886 |
| 2023 | $2,482 | $38,727 | $6,153 | $32,574 |
| 2022 | $2,352 | $36,072 | $5,731 | $30,341 |
| 2021 | $2,169 | $33,921 | $5,389 | $28,532 |
| 2020 | $2,226 | $32,013 | $5,085 | $26,928 |
| 2019 | $1,930 | $29,129 | $5,282 | $23,847 |
| 2018 | $1,882 | $28,297 | $5,131 | $23,166 |
| 2017 | $1,808 | $26,968 | $4,890 | $22,078 |
| 2016 | $1,790 | $26,455 | $4,797 | $21,658 |
| 2014 | $1,732 | $27,590 | $5,032 | $22,558 |
| 2013 | $1,709 | $27,962 | $5,100 | $22,862 |
Source: Public Records
Map
Nearby Homes
- 418 S Main St
- 3830 Breezy Hill
- 1712 Saint Andrews Dr
- 347 Tamarack Ln
- 1606 Fairway Dr
- 501 Master Ct
- 500 Master Ct
- 3719 Thicket Dr
- 13 Eagle Dr
- 3714 Thicket Dr
- 3736 Golfview Cir
- 3706 Thicket Dr
- 3736 Osprey Ct
- 433 Briarberry Dr
- 3725 Osprey Ct
- 3716 Osprey Ct
- 3704 Osprey Ct
- 3700 Osprey Ct
- 3518 Capri Ln
- 109 Eagles Landing Dr
Your Personal Tour Guide
Ask me questions while you tour the home.