Estimated Value: $321,000 - $375,000
4
Beds
3
Baths
3,002
Sq Ft
$113/Sq Ft
Est. Value
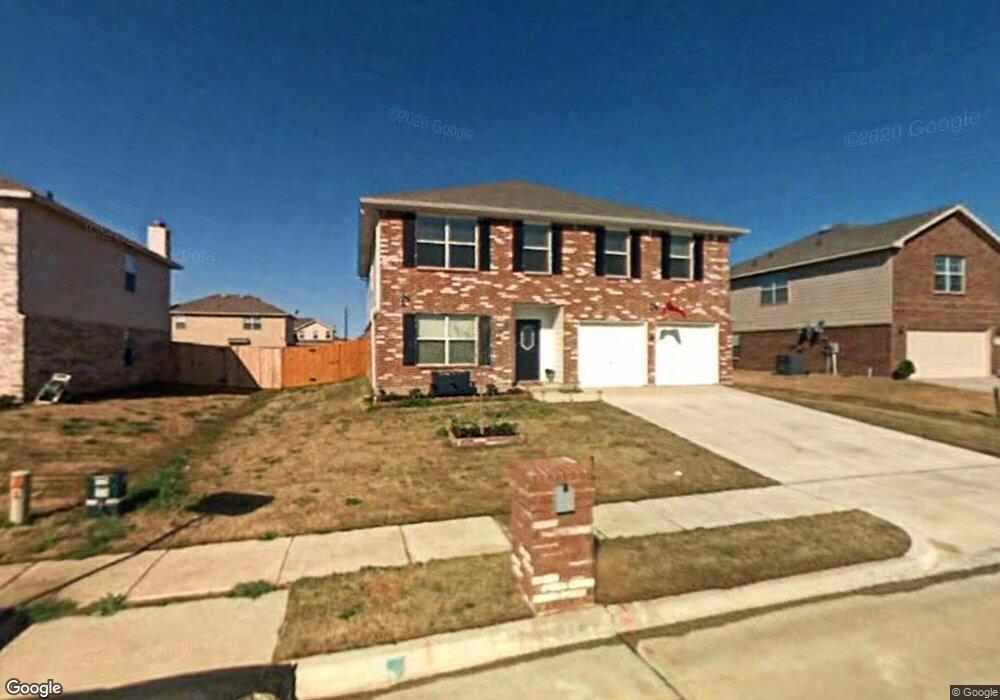
About This Home
This home is located at 313 Saddlebrook Dr, Krum, TX 76249 and is currently estimated at $339,419, approximately $113 per square foot. 313 Saddlebrook Dr is a home located in Denton County with nearby schools including Krum Early Education Center, Blanche Dodd Intermediate School, and Krum Middle School.
Ownership History
Date
Name
Owned For
Owner Type
Purchase Details
Closed on
Feb 13, 2015
Sold by
Dixon Edward W and Dixon Amy L
Bought by
Al Ramahiand Mustafa and Hammad Buthiena
Current Estimated Value
Home Financials for this Owner
Home Financials are based on the most recent Mortgage that was taken out on this home.
Original Mortgage
$140,400
Outstanding Balance
$108,167
Interest Rate
3.92%
Mortgage Type
New Conventional
Estimated Equity
$231,252
Purchase Details
Closed on
Aug 15, 2007
Sold by
Hmh Lifestyles Lp
Bought by
Dixon Edward W and Dixon Amy L
Home Financials for this Owner
Home Financials are based on the most recent Mortgage that was taken out on this home.
Original Mortgage
$141,876
Interest Rate
6.72%
Mortgage Type
Purchase Money Mortgage
Purchase Details
Closed on
Mar 30, 2007
Sold by
Jabez Development Lp
Bought by
Hmh Lifestyles Lp
Create a Home Valuation Report for This Property
The Home Valuation Report is an in-depth analysis detailing your home's value as well as a comparison with similar homes in the area
Home Values in the Area
Average Home Value in this Area
Purchase History
| Date | Buyer | Sale Price | Title Company |
|---|---|---|---|
| Al Ramahiand Mustafa | -- | Title Resources | |
| Dixon Edward W | -- | Stewart Title | |
| Hmh Lifestyles Lp | -- | Stnt |
Source: Public Records
Mortgage History
| Date | Status | Borrower | Loan Amount |
|---|---|---|---|
| Open | Al Ramahiand Mustafa | $140,400 | |
| Previous Owner | Dixon Edward W | $141,876 |
Source: Public Records
Tax History
| Year | Tax Paid | Tax Assessment Tax Assessment Total Assessment is a certain percentage of the fair market value that is determined by local assessors to be the total taxable value of land and additions on the property. | Land | Improvement |
|---|---|---|---|---|
| 2025 | $5,332 | $341,290 | $67,860 | $273,430 |
| 2024 | $6,572 | $326,095 | $0 | $0 |
| 2023 | $4,744 | $296,450 | $67,860 | $311,655 |
| 2022 | $6,182 | $269,500 | $67,860 | $216,140 |
| 2021 | $5,201 | $234,545 | $38,341 | $196,204 |
| 2020 | $5,209 | $230,000 | $42,601 | $187,399 |
| 2019 | $5,188 | $215,000 | $42,601 | $172,399 |
| 2018 | $5,045 | $208,000 | $42,601 | $165,399 |
| 2017 | $4,703 | $193,050 | $42,601 | $160,559 |
| 2016 | $4,275 | $175,500 | $28,275 | $147,225 |
| 2015 | $3,425 | $163,512 | $28,275 | $148,508 |
| 2014 | $3,425 | $148,647 | $28,275 | $122,120 |
| 2013 | -- | $135,134 | $28,275 | $106,859 |
Source: Public Records
Map
Nearby Homes
- 1606 Withers Way
- 334 Saddlebrook Dr
- 205 Comanche Trail
- 105 Thoroughbred Dr
- 101 Thoroughbred Dr
- 3207 Camden Creek Rd
- 0 Farm To Market Road 1173
- TBD Masch Branch Rd
- 3425 Eloise Ln
- 905 Clearview St
- 5276 Albert Ct
- 5258 Albert Ct
- TBD Hopkins Rd
- 3724 Ranchers Ridge
- 3725 Ranchers Ridge
- 107 N 7th St
- 101 N 7th St
- 7272 Christina Ct
- 7257 Christina Ct
- 213 Dove Meadows
- 311 Saddlebrook Dr
- 315 Saddlebrook Dr
- 314 Spurlock Dr
- 309 Saddlebrook Dr
- 312 Spurlock Dr
- 316 Spurlock Dr
- 317 Saddlebrook Dr
- 314 Saddlebrook Dr
- 312 Saddlebrook Dr
- 310 Spurlock Dr
- 316 Saddlebrook Dr
- 400 Spurlock Dr
- 307 Saddlebrook Dr
- 319 Saddlebrook Dr
- 318 Saddlebrook Dr
- 308 Spurlock Dr
- 402 Spurlock Dr
- 1601 Santa fe Trail
- 320 Saddlebrook Dr
- 305 Saddlebrook Dr
Your Personal Tour Guide
Ask me questions while you tour the home.