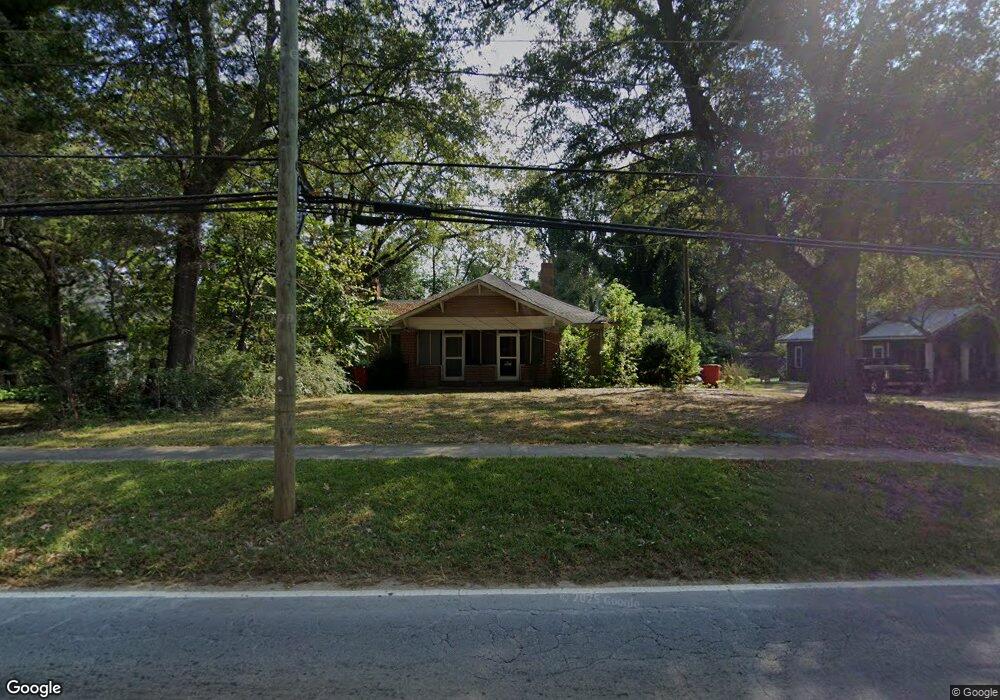
313 Wedowee St Bowdon, GA 30108
Estimated Value: $164,000 - $239,000
4
Beds
3
Baths
2,104
Sq Ft
$92/Sq Ft
Est. Value
About This Home
This home is located at 313 Wedowee St, Bowdon, GA 30108 and is currently estimated at $194,000, approximately $92 per square foot. 313 Wedowee St is a home located in Carroll County with nearby schools including Bowdon Elementary School, Bowdon Middle School, and Bowdon High School.
Ownership History
Date
Name
Owned For
Owner Type
Purchase Details
Closed on
Nov 5, 2008
Sold by
Not Provided
Bought by
Lease Purchase Inc
Current Estimated Value
Home Financials for this Owner
Home Financials are based on the most recent Mortgage that was taken out on this home.
Original Mortgage
$46,500
Interest Rate
5.89%
Mortgage Type
New Conventional
Purchase Details
Closed on
Sep 2, 2008
Sold by
Not Provided
Bought by
Lease Purchase Inc
Home Financials for this Owner
Home Financials are based on the most recent Mortgage that was taken out on this home.
Original Mortgage
$46,500
Interest Rate
5.89%
Mortgage Type
New Conventional
Purchase Details
Closed on
Nov 2, 2001
Sold by
Vangelderen Leon
Bought by
Ingle Michael L
Purchase Details
Closed on
Jan 2, 1996
Sold by
Gelderen
Bought by
Vangelderen Leon
Purchase Details
Closed on
Apr 9, 1992
Sold by
Matthews Etals
Bought by
Gelderen
Purchase Details
Closed on
Apr 6, 1992
Bought by
Johnson Carrie
Create a Home Valuation Report for This Property
The Home Valuation Report is an in-depth analysis detailing your home's value as well as a comparison with similar homes in the area
Home Values in the Area
Average Home Value in this Area
Purchase History
| Date | Buyer | Sale Price | Title Company |
|---|---|---|---|
| Lease Purchase Inc | -- | -- | |
| Lease Purchase Inc | -- | -- | |
| Ingle Michael L | $85,000 | -- | |
| Vangelderen Leon | $60,000 | -- | |
| Gelderen | $10,000 | -- | |
| Johnson Carrie | -- | -- | |
| Matthews Etals | -- | -- |
Source: Public Records
Mortgage History
| Date | Status | Borrower | Loan Amount |
|---|---|---|---|
| Closed | Lease Purchase Inc | $46,500 | |
| Previous Owner | Lease Purchase Inc | $46,500 |
Source: Public Records
Tax History Compared to Growth
Tax History
| Year | Tax Paid | Tax Assessment Tax Assessment Total Assessment is a certain percentage of the fair market value that is determined by local assessors to be the total taxable value of land and additions on the property. | Land | Improvement |
|---|---|---|---|---|
| 2024 | $2,148 | $73,832 | $5,362 | $68,470 |
| 2023 | $2,147 | $67,610 | $5,362 | $62,248 |
| 2022 | $1,733 | $53,520 | $3,572 | $49,948 |
| 2021 | $1,515 | $45,431 | $2,646 | $42,785 |
| 2020 | $1,395 | $41,513 | $2,646 | $38,867 |
| 2019 | $1,319 | $38,693 | $2,646 | $36,047 |
| 2018 | $1,218 | $34,961 | $2,646 | $32,315 |
| 2017 | $1,221 | $34,961 | $2,646 | $32,315 |
| 2016 | $1,180 | $33,774 | $2,646 | $31,128 |
| 2015 | $862 | $23,586 | $4,000 | $19,586 |
| 2014 | $867 | $23,586 | $4,000 | $19,586 |
Source: Public Records
Map
Nearby Homes
- 110 Bevis Cir
- 0 Magnolia St Unit 7657311
- 0 Magnolia St Unit 10614572
- 0 Hwy 100 Unit LotWP001 24911780
- 0 Hwy 100 Unit 10541558
- 310 W College St
- 310 Pine Cir
- 313 Ellenwood Dr
- 101 Winding Road - Lot 1a & 1b & Lot 2
- 425 Mitchell Ave
- 674 Wedowee St
- 407 E College St
- 460 Sally Ann Cir
- 400/460 Sally Ann Cir
- 0 College View St Unit 7641168
- 0 College View St Unit 10594648
- 6.41 ac N Carroll St & Ave W
- 717 Wedowee St
- 427 E College St
- 721 Wedowee St
- 317 Wedowee St
- 311 Wedowee St
- N N Highway 100
- 321 Wedowee St
- 305 Wedowee St
- 316 Wedowee St
- 323 Wedowee St Unit 327
- 322 Wedowee St Unit 322/324
- 322 Wedowee St
- 322 Wedowee St
- 111 Springdale Ave
- 114 Parson St
- 110 Parson Ave Unit A
- 112 Parson Ave Unit A
- 110 Parson Ave
- 110 Parson Ave
- 112 Parson Ave
- 400 Wedowee St
- 0 Springdale Ave Unit 3136323
- 0 Springdale Ave Unit 7434977