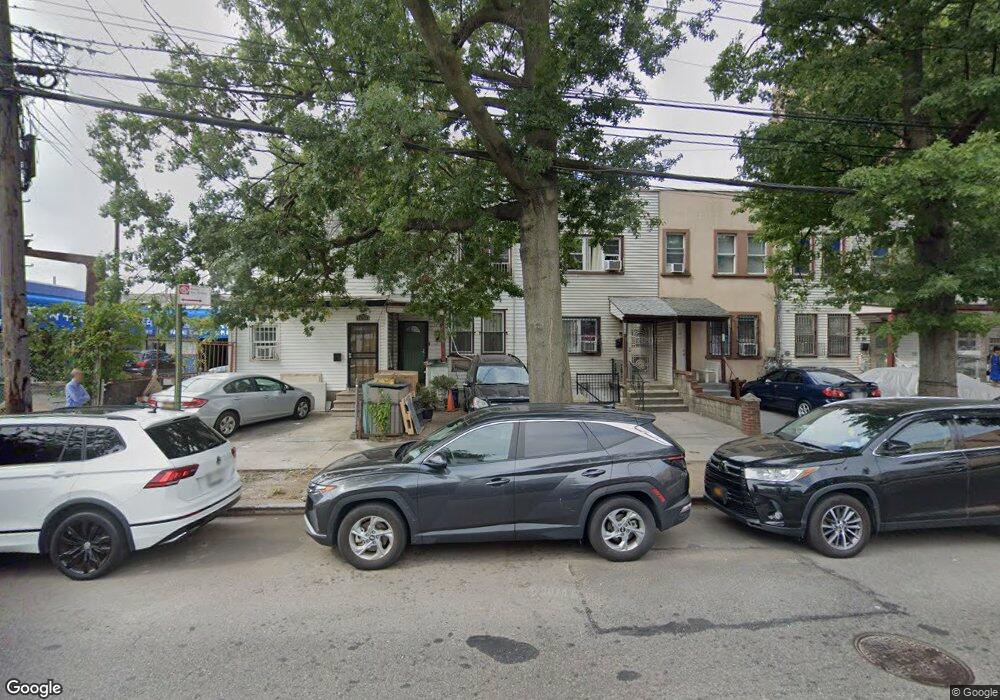
3130 Linden Place Flushing, NY 11354
Flushing NeighborhoodEstimated Value: $868,903 - $962,000
4
Beds
2
Baths
1,200
Sq Ft
$764/Sq Ft
Est. Value
About This Home
This home is located at 3130 Linden Place, Flushing, NY 11354 and is currently estimated at $917,226, approximately $764 per square foot. 3130 Linden Place is a home located in Queens County with nearby schools including P.S. 214 Cadwallader Colden, Jhs 185 Edward Bleeker, and Flushing High School.
Ownership History
Date
Name
Owned For
Owner Type
Purchase Details
Closed on
Sep 24, 2014
Sold by
Dupree Executrix Shakenya and Estate Of Ellen B Saunders
Bought by
Huang Huihong and Liu Bin
Current Estimated Value
Home Financials for this Owner
Home Financials are based on the most recent Mortgage that was taken out on this home.
Original Mortgage
$360,000
Interest Rate
4.1%
Mortgage Type
New Conventional
Purchase Details
Closed on
May 31, 2013
Sold by
Green Deceased Stephen D and Green Green
Bought by
Saunders Ellen
Home Financials for this Owner
Home Financials are based on the most recent Mortgage that was taken out on this home.
Original Mortgage
$666,000
Interest Rate
3.51%
Mortgage Type
Purchase Money Mortgage
Purchase Details
Closed on
Oct 12, 2012
Sold by
Dupree Shakenya Monique and Saunders Ellen B
Bought by
Saunders Ellen B
Purchase Details
Closed on
Apr 24, 2004
Sold by
Ellen B Saunders
Bought by
Shakenya Ellen B and Shakenya Monique Dupree
Create a Home Valuation Report for This Property
The Home Valuation Report is an in-depth analysis detailing your home's value as well as a comparison with similar homes in the area
Home Values in the Area
Average Home Value in this Area
Purchase History
| Date | Buyer | Sale Price | Title Company |
|---|---|---|---|
| Huang Huihong | $605,000 | -- | |
| Huang Huihong | $605,000 | -- | |
| Saunders Ellen | $90,000 | -- | |
| Saunders Ellen | $90,000 | -- | |
| Saunders Ellen B | -- | -- | |
| Saunders Ellen B | -- | -- | |
| Shakenya Ellen B | -- | -- | |
| Saunders Ellen B | -- | -- |
Source: Public Records
Mortgage History
| Date | Status | Borrower | Loan Amount |
|---|---|---|---|
| Previous Owner | Huang Huihong | $360,000 | |
| Previous Owner | Saunders Ellen | $666,000 |
Source: Public Records
Tax History Compared to Growth
Tax History
| Year | Tax Paid | Tax Assessment Tax Assessment Total Assessment is a certain percentage of the fair market value that is determined by local assessors to be the total taxable value of land and additions on the property. | Land | Improvement |
|---|---|---|---|---|
| 2025 | $5,903 | $30,487 | $7,567 | $22,920 |
| 2024 | $5,903 | $29,388 | $6,848 | $22,540 |
| 2023 | $5,569 | $27,727 | $5,925 | $21,802 |
| 2022 | $5,222 | $60,780 | $12,360 | $48,420 |
| 2021 | $5,505 | $50,400 | $12,360 | $38,040 |
| 2020 | $5,378 | $45,900 | $12,360 | $33,540 |
| 2019 | $5,123 | $45,420 | $12,360 | $33,060 |
| 2018 | $4,710 | $23,106 | $6,959 | $16,147 |
| 2017 | $4,444 | $21,799 | $6,461 | $15,338 |
| 2016 | $4,358 | $21,799 | $6,461 | $15,338 |
| 2015 | $2,261 | $21,172 | $11,095 | $10,077 |
| 2014 | $2,261 | $20,409 | $10,695 | $9,714 |
Source: Public Records
Map
Nearby Homes
- 136-16 31st Rd Unit 8A
- 3111 Linden Place Unit 1B
- 13616 31st Rd Unit 8B
- 137-08 31st Rd Unit 5E
- 137-08 31st Rd Unit 6D
- 137-08 31st Rd Unit 2E
- 31-47 137th St Unit 4C
- 31-47 137th St Unit 3C
- 3138 137th St Unit 9B
- 3138 137th St Unit 5A
- 31-41 Linden Place
- 2950 137th St Unit LC
- 31-53 Linden Place Unit 4B
- 31-53 Linden Place Unit 2E
- 31-30 138th St Unit 2
- 137-11 32nd Ave Unit 8E
- 29-49 137th St Unit 3L
- 29-49 137th St Unit 6
- 29-49 137th St Unit 2H
- 29-30 137th St Unit 3C
- 3130 Linden Place
- 31-28 Linden Place
- 3128 Linden Place
- 3132 Linden Place
- 31-32 Linden Place
- 3126 Linden Place
- 3134 Linden Place
- 3124 Linden Place
- 3118 Linden Place
- 3138 Linden Place
- 31-25 Linden Place
- 31-21 Linden Place
- 31-31A Linden Place
- 3114 Linden Place
- 3125 Linden Place
- 3123 Linden Place
- 31-15 Sunrise Hwy
- 31-15 S Conduit Blvd
- 3127 Linden Place
- 3121 Linden Place