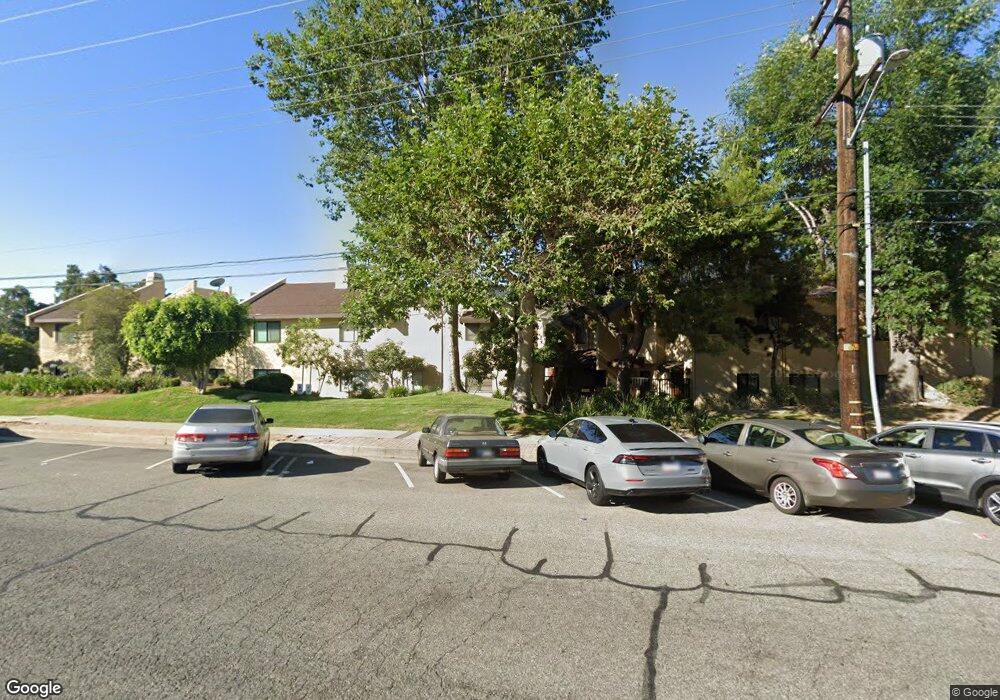
3130 Montrose Ave Unit 122 La Crescenta, CA 91214
Estimated Value: $742,000 - $882,000
3
Beds
3
Baths
1,550
Sq Ft
$510/Sq Ft
Est. Value
About This Home
This home is located at 3130 Montrose Ave Unit 122, La Crescenta, CA 91214 and is currently estimated at $789,867, approximately $509 per square foot. 3130 Montrose Ave Unit 122 is a home located in Los Angeles County with nearby schools including Abraham Lincoln Elementary School, Rosemont Middle School, and Crescenta Valley High School.
Ownership History
Date
Name
Owned For
Owner Type
Purchase Details
Closed on
Sep 13, 2002
Sold by
Jennings Glenn A
Bought by
Jennings Glenn A and Jennings Esther H
Current Estimated Value
Home Financials for this Owner
Home Financials are based on the most recent Mortgage that was taken out on this home.
Original Mortgage
$258,000
Outstanding Balance
$106,595
Interest Rate
6.09%
Estimated Equity
$683,272
Purchase Details
Closed on
Jun 22, 2001
Sold by
Jennings Esther H
Bought by
Jennings Glenn A
Home Financials for this Owner
Home Financials are based on the most recent Mortgage that was taken out on this home.
Original Mortgage
$260,000
Interest Rate
7.14%
Purchase Details
Closed on
Jul 21, 1994
Sold by
Henton Donaby and Wirt Marcia L
Bought by
Barouni Edmond and Barouni Natalie
Home Financials for this Owner
Home Financials are based on the most recent Mortgage that was taken out on this home.
Original Mortgage
$125,600
Interest Rate
8.57%
Create a Home Valuation Report for This Property
The Home Valuation Report is an in-depth analysis detailing your home's value as well as a comparison with similar homes in the area
Home Values in the Area
Average Home Value in this Area
Purchase History
| Date | Buyer | Sale Price | Title Company |
|---|---|---|---|
| Jennings Glenn A | -- | Investors Title Company | |
| Jennings Glenn A | -- | Southland Title Corporation | |
| Jennings Glenn A | $280,000 | Southland Title | |
| Barouni Edmond | $157,000 | -- |
Source: Public Records
Mortgage History
| Date | Status | Borrower | Loan Amount |
|---|---|---|---|
| Open | Jennings Glenn A | $258,000 | |
| Closed | Jennings Glenn A | $260,000 | |
| Previous Owner | Barouni Edmond | $125,600 |
Source: Public Records
Tax History Compared to Growth
Tax History
| Year | Tax Paid | Tax Assessment Tax Assessment Total Assessment is a certain percentage of the fair market value that is determined by local assessors to be the total taxable value of land and additions on the property. | Land | Improvement |
|---|---|---|---|---|
| 2025 | $4,717 | $421,891 | $258,108 | $163,783 |
| 2024 | $4,717 | $413,620 | $253,048 | $160,572 |
| 2023 | $4,612 | $405,511 | $248,087 | $157,424 |
| 2022 | $4,472 | $397,561 | $243,223 | $154,338 |
| 2021 | $4,390 | $389,766 | $238,454 | $151,312 |
| 2019 | $4,222 | $378,207 | $231,382 | $146,825 |
| 2018 | $4,159 | $370,793 | $226,846 | $143,947 |
| 2016 | $3,958 | $356,397 | $218,039 | $138,358 |
| 2015 | $3,878 | $351,044 | $214,764 | $136,280 |
| 2014 | $3,848 | $344,169 | $210,558 | $133,611 |
Source: Public Records
Map
Nearby Homes
- 3115 Piedmont Ave
- 3010 Montrose Ave Unit 33
- 3010 Montrose Ave Unit 3
- 3106 Honolulu Ave
- 3357 Honolulu Ave
- 0 Mountain Oaks Park
- 2817 Montrose Ave
- 4133 La Crescenta Ave
- 3419 Montrose Ave
- 3425 Montrose Ave
- 4357 Pennsylvania Ave
- 2806 Manhattan Ave
- 2743 Montrose Ave Unit 110
- 3346 Altura Ave
- 2754 Montrose Ave
- 4530 Ramsdell Ave Unit 11
- 3928 La Crescenta Ave
- 2614 Mary St
- 2619 Mary St
- 4520 Pennsylvania Ave Unit 120
- 3130 Montrose Ave Unit 15
- 3130 Montrose Ave Unit 115
- 3130 Montrose Ave Unit 118
- 3130 Montrose Ave Unit 121
- 3130 Montrose Ave Unit 113
- 3130 Montrose Ave Unit 116
- 3130 Montrose Ave Unit 108
- 3130 Montrose Ave Unit 106
- 3130 Montrose Ave Unit 120
- 3130 Montrose Ave Unit 101
- 3130 Montrose Ave Unit 117
- 3130 Montrose Ave Unit 111
- 3130 Montrose Ave Unit 112
- 3130 Montrose Ave Unit 114
- 3130 Montrose Ave Unit 105
- 3130 Montrose Ave Unit 103
- 3130 Montrose Ave Unit 119
- 3130 Montrose Ave Unit 124
- 3130 Montrose Ave Unit 123
- 3130 Montrose Ave Unit 107