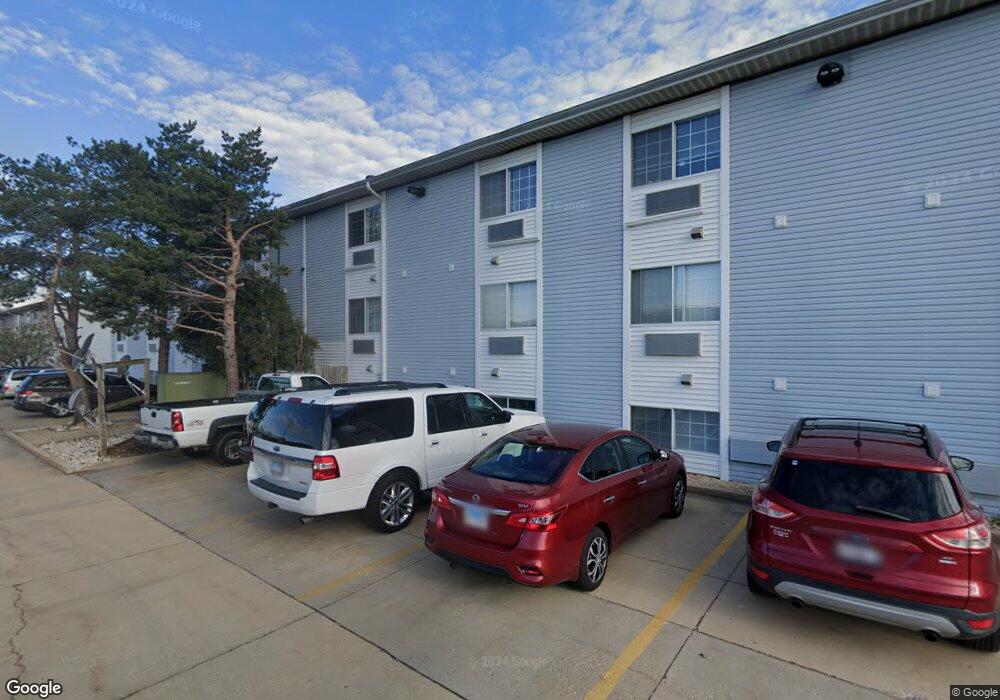
3130 W Monroe St, Unit STPH230 Waukegan, IL 60085
Southwest Waukegan NeighborhoodEstimated Value: $82,000 - $88,000
1
Bed
1
Bath
450
Sq Ft
$191/Sq Ft
Est. Value
About This Home
This home is located at 3130 W Monroe St Unit STPH230, Waukegan, IL 60085 and is currently estimated at $85,733, approximately $190 per square foot. 3130 W Monroe St Unit STPH230 is a home located in Lake County with nearby schools including Glenwood Elementary School, Robert E. Abbott Middle School, and Waukegan High School.
Ownership History
Date
Name
Owned For
Owner Type
Purchase Details
Closed on
Oct 23, 2018
Sold by
Martinez Flores Selene and Martinez Gonzalez Geronimo
Bought by
Todoran Silviu Adrian
Current Estimated Value
Purchase Details
Closed on
Mar 9, 2015
Sold by
Connolley Maybelline and Connolly Maybelline
Bought by
Flores Selene
Purchase Details
Closed on
Apr 27, 2007
Sold by
Pizarro Alejandro
Bought by
Connolly Maybelline
Home Financials for this Owner
Home Financials are based on the most recent Mortgage that was taken out on this home.
Original Mortgage
$5,000
Interest Rate
6.2%
Mortgage Type
Unknown
Purchase Details
Closed on
Jul 17, 2002
Sold by
Bank Of Waukegan
Bought by
Pizarro Alejandro
Home Financials for this Owner
Home Financials are based on the most recent Mortgage that was taken out on this home.
Original Mortgage
$58,675
Interest Rate
6.63%
Mortgage Type
FHA
Create a Home Valuation Report for This Property
The Home Valuation Report is an in-depth analysis detailing your home's value as well as a comparison with similar homes in the area
Home Values in the Area
Average Home Value in this Area
Purchase History
| Date | Buyer | Sale Price | Title Company |
|---|---|---|---|
| Todoran Silviu Adrian | $46,500 | First American Title | |
| Flores Selene | $22,000 | Ct | |
| Connolly Maybelline | $78,500 | None Available | |
| Pizarro Alejandro | $60,500 | -- |
Source: Public Records
Mortgage History
| Date | Status | Borrower | Loan Amount |
|---|---|---|---|
| Previous Owner | Connolly Maybelline | $5,000 | |
| Previous Owner | Pizarro Alejandro | $58,675 |
Source: Public Records
Tax History Compared to Growth
Tax History
| Year | Tax Paid | Tax Assessment Tax Assessment Total Assessment is a certain percentage of the fair market value that is determined by local assessors to be the total taxable value of land and additions on the property. | Land | Improvement |
|---|---|---|---|---|
| 2024 | $937 | $21,105 | $2,650 | $18,455 |
| 2023 | $840 | $17,918 | $2,250 | $15,668 |
| 2022 | $840 | $14,573 | $1,684 | $12,889 |
| 2021 | $883 | $14,446 | $1,669 | $12,777 |
| 2020 | $847 | $13,458 | $1,555 | $11,903 |
| 2019 | $800 | $12,332 | $1,425 | $10,907 |
| 2018 | $410 | $9,537 | $1,512 | $8,025 |
| 2017 | $349 | $8,438 | $1,338 | $7,100 |
| 2016 | $208 | $8,620 | $1,163 | $7,457 |
| 2015 | $290 | $7,715 | $1,041 | $6,674 |
| 2014 | $864 | $10,646 | $1,045 | $9,601 |
| 2012 | $1,291 | $11,535 | $1,132 | $10,403 |
Source: Public Records
About This Building
Map
Nearby Homes
- 3170 W Monroe St Unit 309
- 525 Lawrence Ave
- 102 Baldwin Ave
- 34887 N Austin Ave
- 603 N Austin Ave
- 621 N Austin Ave
- 3482 Ellis Ave
- 24 Washington Terrace
- 3210 W Grandview Ave
- 12698 W Grandview Ave
- 12716 W Grandview Ave
- 0 Brookside Ave
- 3503 Elaine Ave
- 963 Belle Plaine Ave
- 2726 W Hidden Glen Dr
- 35400 N Green Bay Rd
- 964 Magnolia Ave
- 1048 Belle Plaine Ave
- 3409 Glen Flora Ave
- 2115 Lydia St
- 3130 W Monroe St Unit 315
- 3130 W Monroe St Unit 103
- 3130 W Monroe St Unit 309
- 3130 W Monroe St Unit STPH231
- 3130 W Monroe St Unit STPH231
- 3130 W Monroe St Unit STPH231
- 3130 W Monroe St Unit STPH231
- 3130 W Monroe St Unit 313
- 3130 W Monroe St Unit STPH231
- 3130 W Monroe St Unit STPH231
- 3130 W Monroe St Unit STPH231
- 3130 W Monroe St Unit STPH230
- 3130 W Monroe St Unit STPH230
- 3130 W Monroe St Unit STPH230
- 3130 W Monroe St Unit STPH230
- 3130 W Monroe St Unit STPH230
- 3130 W Monroe St Unit STPH230
- 3130 W Monroe St Unit STPH230
- 3130 W Monroe St Unit STPH230
- 3130 W Monroe St Unit STPH221