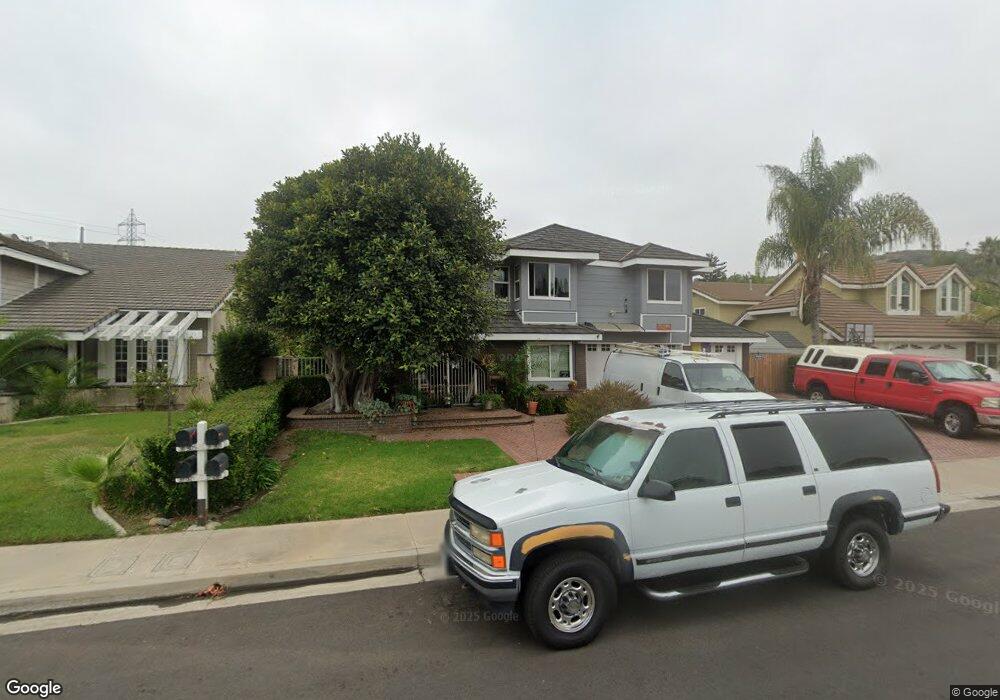
31301 Via Parra San Juan Capistrano, CA 92675
Estimated Value: $1,708,000 - $1,923,000
4
Beds
3
Baths
2,916
Sq Ft
$625/Sq Ft
Est. Value
About This Home
This home is located at 31301 Via Parra, San Juan Capistrano, CA 92675 and is currently estimated at $1,821,239, approximately $624 per square foot. 31301 Via Parra is a home located in Orange County with nearby schools including Harold Ambuehl Elementary School, Marco Forster Middle School, and San Juan Hills High School.
Ownership History
Date
Name
Owned For
Owner Type
Purchase Details
Closed on
Jun 13, 2001
Sold by
Xanders Rex L and Xanders Debra L
Bought by
Bordner Kenneth R and Bordner Deborah A
Current Estimated Value
Home Financials for this Owner
Home Financials are based on the most recent Mortgage that was taken out on this home.
Original Mortgage
$425,000
Outstanding Balance
$162,718
Interest Rate
7.21%
Mortgage Type
Purchase Money Mortgage
Estimated Equity
$1,658,521
Purchase Details
Closed on
Oct 7, 1999
Sold by
Finney Michael S and Finney Geralee L
Bought by
Xanders Rex L and Xanders Debra L
Home Financials for this Owner
Home Financials are based on the most recent Mortgage that was taken out on this home.
Original Mortgage
$281,450
Interest Rate
3.45%
Create a Home Valuation Report for This Property
The Home Valuation Report is an in-depth analysis detailing your home's value as well as a comparison with similar homes in the area
Home Values in the Area
Average Home Value in this Area
Purchase History
| Date | Buyer | Sale Price | Title Company |
|---|---|---|---|
| Bordner Kenneth R | -- | American Title Co | |
| Xanders Rex L | $433,000 | -- |
Source: Public Records
Mortgage History
| Date | Status | Borrower | Loan Amount |
|---|---|---|---|
| Open | Bordner Kenneth R | $425,000 | |
| Previous Owner | Xanders Rex L | $281,450 |
Source: Public Records
Tax History Compared to Growth
Tax History
| Year | Tax Paid | Tax Assessment Tax Assessment Total Assessment is a certain percentage of the fair market value that is determined by local assessors to be the total taxable value of land and additions on the property. | Land | Improvement |
|---|---|---|---|---|
| 2025 | $8,907 | $819,897 | $485,253 | $334,644 |
| 2024 | $8,907 | $803,821 | $475,738 | $328,083 |
| 2023 | $8,671 | $788,060 | $466,410 | $321,650 |
| 2022 | $8,249 | $772,608 | $457,264 | $315,344 |
| 2021 | $8,102 | $757,459 | $448,298 | $309,161 |
| 2020 | $8,033 | $749,693 | $443,702 | $305,991 |
| 2019 | $7,889 | $734,994 | $435,002 | $299,992 |
| 2018 | $7,753 | $720,583 | $426,473 | $294,110 |
| 2017 | $7,684 | $706,454 | $418,110 | $288,344 |
| 2016 | $7,548 | $692,602 | $409,911 | $282,691 |
| 2015 | $7,437 | $682,199 | $403,754 | $278,445 |
| 2014 | $7,310 | $668,836 | $395,845 | $272,991 |
Source: Public Records
Map
Nearby Homes
- 27681 Paseo Esteban
- 31062 Casa Grande Dr
- 30967 Steeplechase Dr
- 30932 Steeplechase Dr
- 27703 Ortega Hwy Unit 127
- 27703 Ortega Hwy Unit 13
- 31192 Via Cordova
- 28051 Calle Santa Ynez
- 27281 Calle de la Rosa
- 27591 Rolling Wood Ln
- 27381 Via Priorato
- 27782 Via Madrina
- 31645 Rancho Viejo Rd
- 10 Strawberry Ln
- 30981 Via Mirador
- 31321 Via Las Palmas
- 32055 Via Canela
- 28481 Avenida la Mancha
- 27821 Golden Ridge Ln
- 30951 Via Bravo
- 31281 Via Parra
- 31305 Via Parra
- 31292 Via Cuartel
- 31271 Via Parra
- 31321 Via Parra
- 31282 Via Cuartel
- 31302 Via Cuartel
- 31292 Via Parra
- 31272 Via Cuartel
- 31302 Via Parra
- 31261 Via Parra
- 31272 Via Parra
- 31312 Via Parra
- 31266 Via Parra
- 31256 Via Cuartel
- 31332 Via Parra
- 27752 Paseo Barona
- 31241 Via Parra
- 27742 Paseo Barona
- 27762 Paseo Barona