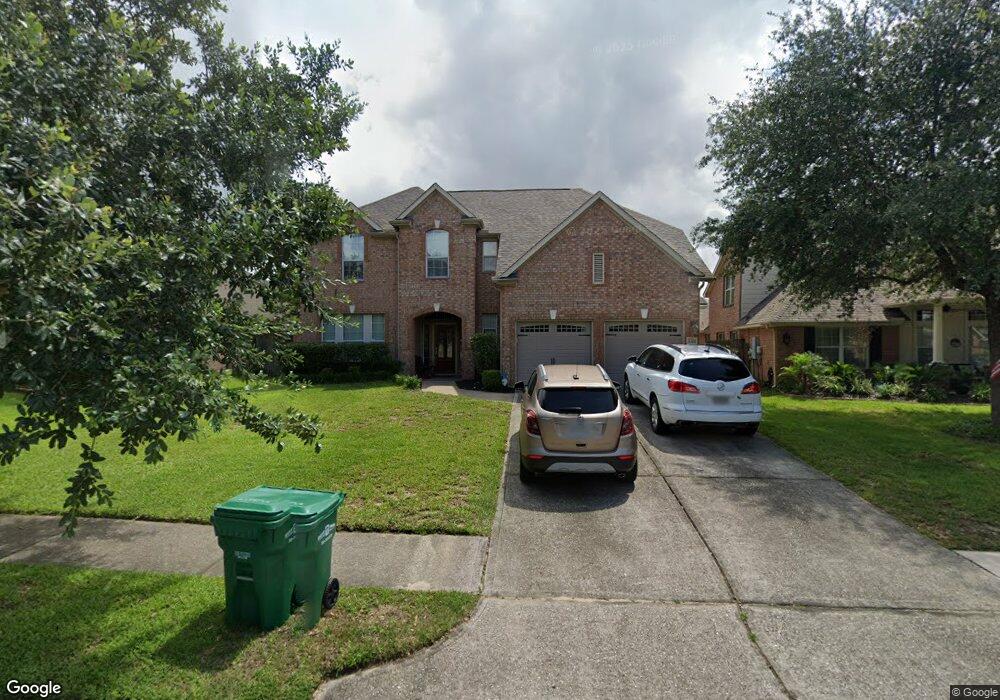
31302 Ribbonwood Park Ln Spring, TX 77386
Imperial Oaks NeighborhoodEstimated Value: $367,773 - $422,000
4
Beds
3
Baths
2,737
Sq Ft
$147/Sq Ft
Est. Value
About This Home
This home is located at 31302 Ribbonwood Park Ln, Spring, TX 77386 and is currently estimated at $403,193, approximately $147 per square foot. 31302 Ribbonwood Park Ln is a home located in Montgomery County with nearby schools including Kaufman Elementary School, Vogel Intermediate School, and Irons J High School.
Ownership History
Date
Name
Owned For
Owner Type
Purchase Details
Closed on
Aug 26, 2010
Sold by
Bac Home Loans Servicing Lp
Bought by
Robinson Steven and Robinson Carole
Current Estimated Value
Home Financials for this Owner
Home Financials are based on the most recent Mortgage that was taken out on this home.
Original Mortgage
$164,780
Outstanding Balance
$109,690
Interest Rate
4.6%
Mortgage Type
FHA
Estimated Equity
$293,503
Purchase Details
Closed on
Feb 2, 2010
Sold by
Vannuoi
Bought by
Bac Home Loans Servicing Lp and Countrywide Home Loans Servicing Lp
Purchase Details
Closed on
Jul 27, 2006
Sold by
Mhi Partnership Ltd
Bought by
Vannuoi
Home Financials for this Owner
Home Financials are based on the most recent Mortgage that was taken out on this home.
Original Mortgage
$164,400
Interest Rate
6.66%
Mortgage Type
Purchase Money Mortgage
Create a Home Valuation Report for This Property
The Home Valuation Report is an in-depth analysis detailing your home's value as well as a comparison with similar homes in the area
Home Values in the Area
Average Home Value in this Area
Purchase History
| Date | Buyer | Sale Price | Title Company |
|---|---|---|---|
| Robinson Steven | -- | Charter Title Company | |
| Bac Home Loans Servicing Lp | $165,600 | None Available | |
| Vannuoi | -- | Millennium Title Houston |
Source: Public Records
Mortgage History
| Date | Status | Borrower | Loan Amount |
|---|---|---|---|
| Open | Robinson Steven | $164,780 | |
| Previous Owner | Vannuoi | $164,400 |
Source: Public Records
Tax History Compared to Growth
Tax History
| Year | Tax Paid | Tax Assessment Tax Assessment Total Assessment is a certain percentage of the fair market value that is determined by local assessors to be the total taxable value of land and additions on the property. | Land | Improvement |
|---|---|---|---|---|
| 2025 | $6,421 | $376,946 | $68,000 | $308,946 |
| 2024 | $5,892 | $345,499 | -- | -- |
| 2023 | $5,892 | $314,090 | $68,000 | $274,730 |
| 2022 | $7,296 | $285,540 | $29,080 | $307,940 |
| 2021 | $7,171 | $259,580 | $29,080 | $230,500 |
| 2020 | $7,369 | $255,510 | $29,080 | $226,430 |
| 2019 | $7,593 | $256,140 | $29,080 | $227,060 |
| 2018 | $6,551 | $245,740 | $29,080 | $216,660 |
| 2017 | $7,327 | $245,740 | $29,080 | $216,660 |
| 2016 | $7,080 | $237,470 | $29,080 | $209,890 |
| 2015 | $5,667 | $215,880 | $29,080 | $201,430 |
| 2014 | $5,667 | $196,250 | $29,080 | $186,880 |
Source: Public Records
Map
Nearby Homes
- 3002 Rusty Bridge Ct
- 31527 Reston Cliff Ct
- 31563 Ember Trail Ln
- 31011 Imperial Walk Ln
- 2618 Bridgestone Park Ln
- 31419 Fountainbrook Park Ln
- 3317 Starlight Hill Ct
- 30915 Still Oaks Ln
- 2715 Kingsbury Park Ln
- 31525 Ember Trail Ln
- 2954 Smokey Forest Ln
- 3320 Atwood Creek Ct
- 32364 Mossy Pine Way
- 3301 Asbury Glen Ct
- 31602 Forest Oak Park Ct
- 31214 Windcrest Park Ln
- 3417 Acacia Grove Ln
- 31235 Windcrest Park Ln
- 2898 Woodland Glen Ln
- 2526 Hidden Park Ln
- 31306 Ribbonwood Park Ln
- 31230 Ribbonwood Park Ln
- 31219 Trinity Park Ln
- 31310 Ribbonwood Park Ln
- 31215 Trinity Park Ln
- 31303 Trinity Park Ln
- 31226 Ribbonwood Park Ln
- 31211 Trinity Park Ln
- 31303 Ribbonwood Park Ln
- 31307 Trinity Park Ln
- 31231 Ribbonwood Park Ln
- 31314 Ribbonwood Park Ln
- 31307 Ribbonwood Park Ln
- 31207 Trinity Park Ln
- 2903 Rosehill Park Ln
- 31311 Ribbonwood Park Ln
- 31227 Ribbonwood Park Ln
- 31311 Trinity Park Ln
- 31318 Ribbonwood Park Ln
- 2907 Rosehill Park Ln