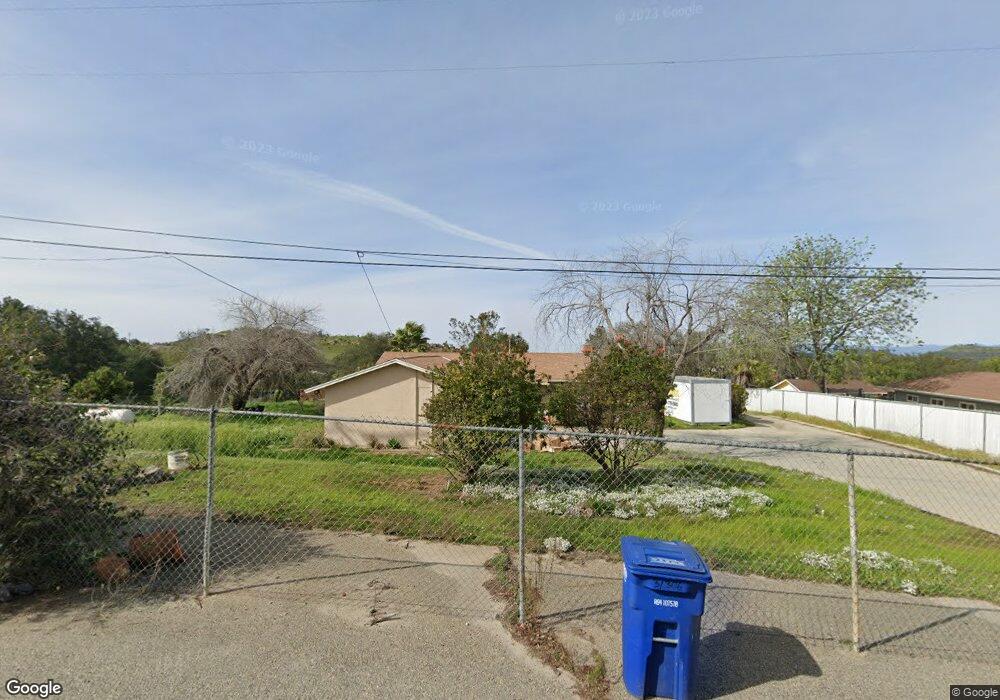
31306 Stardust Ln Valley Center, CA 92082
Estimated Value: $660,053 - $708,000
3
Beds
1
Bath
1,156
Sq Ft
$596/Sq Ft
Est. Value
About This Home
This home is located at 31306 Stardust Ln, Valley Center, CA 92082 and is currently estimated at $688,513, approximately $595 per square foot. 31306 Stardust Ln is a home located in San Diego County with nearby schools including Valley Center Middle School, Oak Glen High School, and Valley Center High School.
Ownership History
Date
Name
Owned For
Owner Type
Purchase Details
Closed on
May 23, 2017
Sold by
Matson Terry and Matson Renee
Bought by
Matson Terry A and Matson Renee A
Current Estimated Value
Purchase Details
Closed on
Feb 4, 2016
Sold by
Matson Terry and Matson Renee
Bought by
Matson Terry and Matson Renee
Purchase Details
Closed on
Sep 9, 2014
Sold by
Matson Gilbert & Barbara Living Trust
Bought by
Matson Terry and Matson Renee
Home Financials for this Owner
Home Financials are based on the most recent Mortgage that was taken out on this home.
Original Mortgage
$340,000
Outstanding Balance
$259,811
Interest Rate
4.09%
Mortgage Type
Unknown
Estimated Equity
$428,702
Purchase Details
Closed on
Aug 19, 2002
Sold by
Matson Gilbert L and Matson Barbara J
Bought by
Matson Gilbert Lavon and Matson Barbara Jeanette
Create a Home Valuation Report for This Property
The Home Valuation Report is an in-depth analysis detailing your home's value as well as a comparison with similar homes in the area
Home Values in the Area
Average Home Value in this Area
Purchase History
| Date | Buyer | Sale Price | Title Company |
|---|---|---|---|
| Matson Terry A | -- | None Available | |
| Matson Terry | -- | None Available | |
| Matson Terry | $340,000 | None Available | |
| Matson Gilbert Lavon | -- | -- |
Source: Public Records
Mortgage History
| Date | Status | Borrower | Loan Amount |
|---|---|---|---|
| Open | Matson Terry | $340,000 |
Source: Public Records
Tax History Compared to Growth
Tax History
| Year | Tax Paid | Tax Assessment Tax Assessment Total Assessment is a certain percentage of the fair market value that is determined by local assessors to be the total taxable value of land and additions on the property. | Land | Improvement |
|---|---|---|---|---|
| 2025 | $4,598 | $408,621 | $144,218 | $264,403 |
| 2024 | $4,598 | $400,610 | $141,391 | $259,219 |
| 2023 | $4,492 | $392,756 | $138,619 | $254,137 |
| 2022 | $4,410 | $385,055 | $135,901 | $249,154 |
| 2021 | $4,322 | $377,506 | $133,237 | $244,269 |
| 2020 | $4,275 | $373,636 | $131,871 | $241,765 |
| 2019 | $4,290 | $366,311 | $129,286 | $237,025 |
| 2018 | $4,174 | $359,129 | $126,751 | $232,378 |
| 2017 | $4,086 | $352,088 | $124,266 | $227,822 |
| 2016 | $4,092 | $345,185 | $121,830 | $223,355 |
| 2015 | $4,056 | $340,000 | $120,000 | $220,000 |
| 2014 | $965 | $69,322 | $25,042 | $44,280 |
Source: Public Records
Map
Nearby Homes
- 31600 Oak Glen Rd
- 40 Oak Glen Rd
- 77.78 ac Jeffrey Heights Rd
- 13815 Hilldale Rd
- 13511 Hilldale Rd
- 13764 Mcnally Rd
- 14053 Mcnally Rd
- 13584 Mcnally Rd
- 0 Pauma Heights Rd Unit 9
- 0 Mcnally Rd Unit NDP2506437
- 13723 Pauma Vista Dr Unit 130-141-0600, 130-14
- 13701 Pauma Vista Dr Unit 130-141-0700
- 14786 Cool Valley Ranch Rd
- 14748 Cool Valley Ranch Rd
- 30237 Cole Grade Rd
- 14443 Cool Valley Rd
- 36353 Carney Rd
- 30118 Miller Rd Unit 22
- 36485 Carney Rd
- 30785 Pauma Heights Rd
- 0 W Oak Glen Rd Unit A
- 31320 Stardust Ln Unit A
- 31320 Stardust Ln
- 13520 W Oak Glen Rd
- 000 Stardust Ln
- 13533 W Oak Glen Rd
- 13626 W Oak Glen Rd
- 13671 Acorn Cir
- 31335 Stardust Ln
- 31330 Stardust Ln
- 13516 W Oak Glen Rd
- 13638 W Oak Glen Rd
- 13669 Acorn Cir
- 13517 W Oak Glen Rd
- 13490 Hilltop Terrace
- 13505 W Oak Glen Rd
- 13496 Hilltop Terrace
- 13474 Hilltop Terrace Unit Y
- 13535 Nikki Ln
- 13652 Acorn Cir