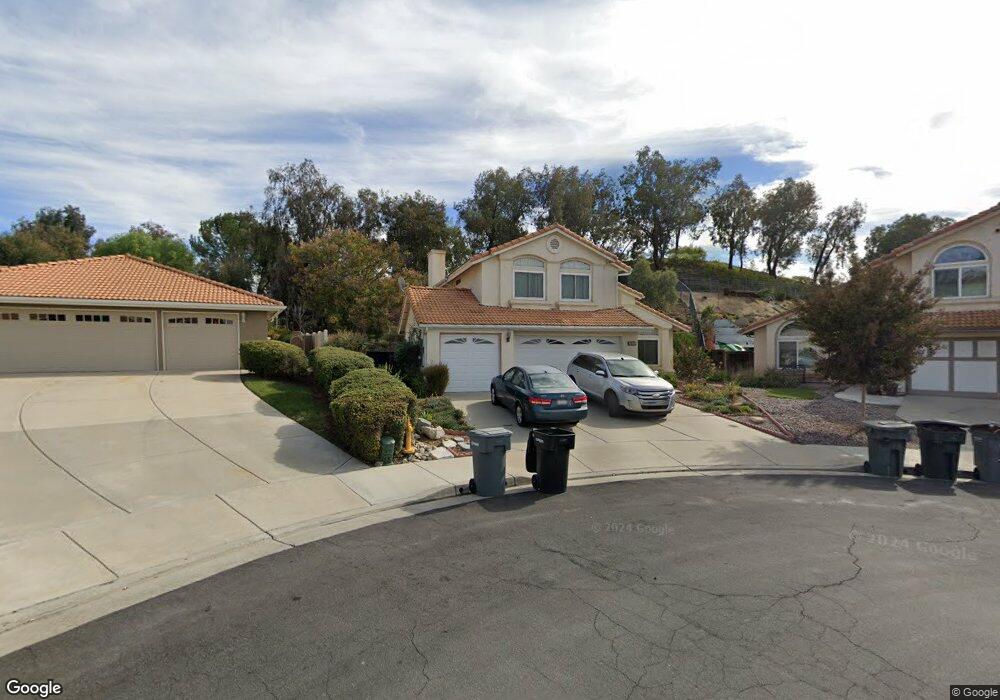
31309 Durney Ct Temecula, CA 92591
Chardonnay Hills NeighborhoodEstimated Value: $665,000 - $801,682
4
Beds
3
Baths
1,977
Sq Ft
$371/Sq Ft
Est. Value
About This Home
This home is located at 31309 Durney Ct, Temecula, CA 92591 and is currently estimated at $733,921, approximately $371 per square foot. 31309 Durney Ct is a home located in Riverside County with nearby schools including Rancho Elementary School, Margarita Middle School, and Temecula Valley High School.
Ownership History
Date
Name
Owned For
Owner Type
Purchase Details
Closed on
Oct 20, 2004
Sold by
Rendeiro Manuel and Rendeiro Nancy
Bought by
Skusek David A and Skusek Carol L
Current Estimated Value
Home Financials for this Owner
Home Financials are based on the most recent Mortgage that was taken out on this home.
Original Mortgage
$343,900
Outstanding Balance
$172,822
Interest Rate
5.99%
Mortgage Type
Stand Alone First
Estimated Equity
$561,099
Purchase Details
Closed on
Oct 23, 1996
Sold by
Rendeiro Manuel J
Bought by
Rendeiro Manuel J and Rendeiro Nancy J
Home Financials for this Owner
Home Financials are based on the most recent Mortgage that was taken out on this home.
Original Mortgage
$155,736
Interest Rate
8.11%
Mortgage Type
VA
Purchase Details
Closed on
Apr 12, 1995
Sold by
Rendeiro David J
Bought by
Rendeiro Manuel J
Create a Home Valuation Report for This Property
The Home Valuation Report is an in-depth analysis detailing your home's value as well as a comparison with similar homes in the area
Home Values in the Area
Average Home Value in this Area
Purchase History
| Date | Buyer | Sale Price | Title Company |
|---|---|---|---|
| Skusek David A | $430,000 | First American Title Co | |
| Rendeiro Manuel J | -- | Ati Title Company | |
| Rendeiro Manuel J | -- | -- |
Source: Public Records
Mortgage History
| Date | Status | Borrower | Loan Amount |
|---|---|---|---|
| Open | Skusek David A | $343,900 | |
| Previous Owner | Rendeiro Manuel J | $155,736 | |
| Closed | Skusek David A | $85,980 |
Source: Public Records
Tax History
| Year | Tax Paid | Tax Assessment Tax Assessment Total Assessment is a certain percentage of the fair market value that is determined by local assessors to be the total taxable value of land and additions on the property. | Land | Improvement |
|---|---|---|---|---|
| 2025 | $6,945 | $599,355 | $139,375 | $459,980 |
| 2023 | $6,945 | $576,083 | $133,964 | $442,119 |
| 2022 | $6,733 | $564,788 | $131,338 | $433,450 |
| 2021 | $6,132 | $512,291 | $118,775 | $393,516 |
| 2020 | $5,513 | $457,403 | $106,049 | $351,354 |
| 2019 | $5,382 | $444,080 | $102,960 | $341,120 |
| 2018 | $5,182 | $427,000 | $99,000 | $328,000 |
| 2017 | $4,980 | $409,000 | $95,000 | $314,000 |
| 2016 | $4,918 | $404,000 | $94,000 | $310,000 |
| 2015 | $4,317 | $352,000 | $82,000 | $270,000 |
| 2014 | $4,338 | $359,000 | $83,000 | $276,000 |
Source: Public Records
Map
Nearby Homes
- 31461 Congressional Dr
- 31345 Avenida Del Reposo
- 41194 Sea Island Ct
- 0 Winchester Rd Unit IG26012987
- 0 Vista Del Monte Rd Unit SW24075540
- 41087 Promenade Chardonnay Hills
- 32130 Fiesta Ranch Rd S
- 41574 Eagle Point Way
- 31939 Calle Elenita
- 40973 Cebu Dr
- 40900 Via Los Altos
- 40601 Cebu St
- 31465 Inverness Ct
- 40579 New Town Dr
- 41657 Cypress Point Way
- 41606 Slice Way
- 41686 Monterey Place
- 41451 Royal Dornoch Ct
- 31444 Pennant Ct
- 31235 Calle Felicidad
- 31293 Durney Ct
- 31308 Durney Ct
- 41104 Vintage Cir
- 41090 Vintage Cir
- 31296 Durney Ct
- 41112 Vintage Cir
- 31333 Heitz Ln
- 31325 Heitz Ln
- 31288 Durney Ct
- 40989 Promenade Chardonnay Hills
- 41074 Vintage Cir
- 40995 Promenade Chardonnay Hills
- 31317 Heitz Ln
- 40983 Promenade Chardonnay Hills
- 41001 Promenade Chardonnay Hills
- 40977 Promenade Chardonnay Hills
- 41007 Promenade Chardonnay Hills
- 31309 Heitz Ln
- 41064 Vintage Cir
- 41013 Promenade Chardonnay Hills
Your Personal Tour Guide
Ask me questions while you tour the home.