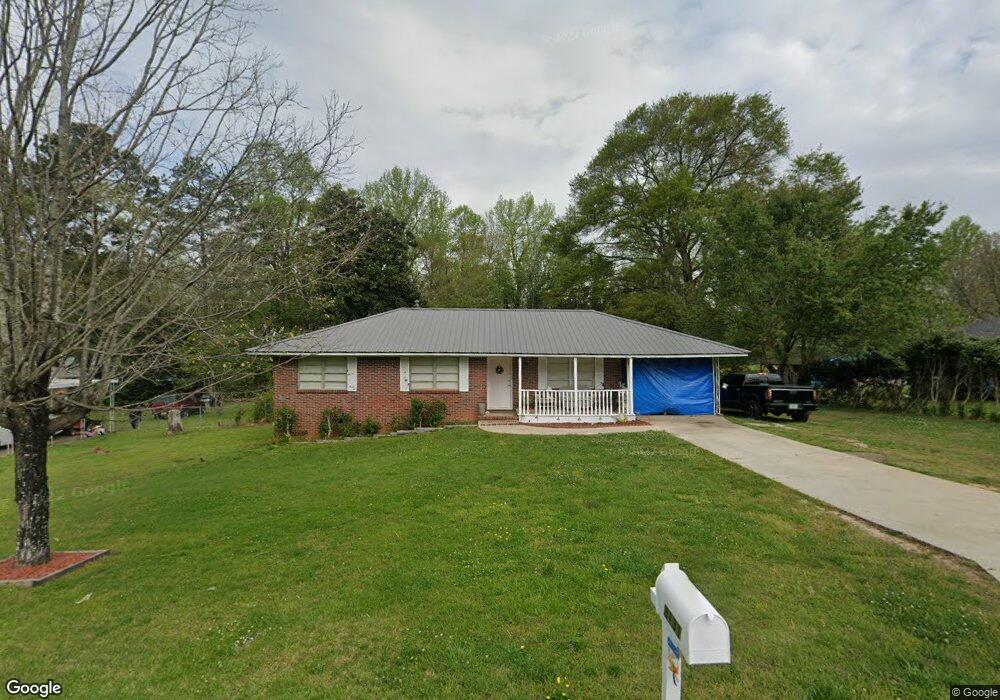
3131 Buice Cir Gainesville, GA 30504
West Side NeighborhoodEstimated Value: $188,000 - $266,000
3
Beds
1
Bath
1,161
Sq Ft
$203/Sq Ft
Est. Value
About This Home
This home is located at 3131 Buice Cir, Gainesville, GA 30504 and is currently estimated at $235,813, approximately $203 per square foot. 3131 Buice Cir is a home located in Hall County with nearby schools including Chicopee Elementary School, West Hall Middle School, and West Hall High School.
Ownership History
Date
Name
Owned For
Owner Type
Purchase Details
Closed on
Mar 11, 2011
Sold by
Hud & Housing Of Urban Dev
Bought by
Sisson Wesley
Current Estimated Value
Purchase Details
Closed on
Aug 3, 2010
Sold by
Citimortgage
Bought by
Hud & Housing Of Urban Dev
Purchase Details
Closed on
Jun 25, 2004
Sold by
Penaloza Camila and Penaloza Alvarado, J
Bought by
Penaloza Camila
Purchase Details
Closed on
Jun 16, 2004
Sold by
Penaloza Camila
Bought by
Penaloza Camila and Alvarado Juan A
Purchase Details
Closed on
Aug 8, 2000
Sold by
Giraldo Clara
Bought by
Penaloza Camila
Home Financials for this Owner
Home Financials are based on the most recent Mortgage that was taken out on this home.
Original Mortgage
$89,928
Interest Rate
8.23%
Mortgage Type
FHA
Purchase Details
Closed on
Nov 18, 1996
Sold by
Whitfield Michael Patricia
Bought by
Giraldo Clara and Salgado William
Create a Home Valuation Report for This Property
The Home Valuation Report is an in-depth analysis detailing your home's value as well as a comparison with similar homes in the area
Home Values in the Area
Average Home Value in this Area
Purchase History
| Date | Buyer | Sale Price | Title Company |
|---|---|---|---|
| Sisson Wesley | -- | -- | |
| Hud & Housing Of Urban Dev | -- | -- | |
| Citimortgage | $103,381 | -- | |
| Penaloza Camila | -- | -- | |
| Penaloza Camila | -- | -- | |
| Penaloza Camila | $90,000 | -- | |
| Giraldo Clara | $77,000 | -- |
Source: Public Records
Mortgage History
| Date | Status | Borrower | Loan Amount |
|---|---|---|---|
| Previous Owner | Penaloza Camila | $89,928 | |
| Closed | Giraldo Clara | $0 |
Source: Public Records
Tax History Compared to Growth
Tax History
| Year | Tax Paid | Tax Assessment Tax Assessment Total Assessment is a certain percentage of the fair market value that is determined by local assessors to be the total taxable value of land and additions on the property. | Land | Improvement |
|---|---|---|---|---|
| 2024 | $1,651 | $63,868 | $5,200 | $58,668 |
| 2023 | $1,668 | $64,588 | $5,200 | $59,388 |
| 2022 | $1,390 | $51,108 | $5,200 | $45,908 |
| 2021 | $1,319 | $47,468 | $5,200 | $42,268 |
| 2020 | $1,296 | $45,228 | $5,200 | $40,028 |
| 2019 | $1,109 | $37,948 | $5,200 | $32,748 |
| 2018 | $971 | $31,837 | $5,200 | $26,637 |
| 2017 | $962 | $31,837 | $5,200 | $26,637 |
| 2016 | $940 | $31,837 | $5,200 | $26,637 |
| 2015 | $1,051 | $35,637 | $9,000 | $26,637 |
| 2014 | $1,051 | $35,637 | $9,000 | $26,637 |
Source: Public Records
Map
Nearby Homes
- 4117 Black Birch Run
- 4219 Box Elder Path
- 5295 Way Unit 181
- 5287 Magnolia Place Unit 179
- 4248 Box Elder Path
- 4319 Box Elder Path
- 4245 Pearhaven Ln SW
- 2116 Memorial Park Dr
- 4554 Silver Oak Dr SW
- 4636 Silver Oak Dr SW
- 4405 Chestnut Oak Way SW
- 4549 Cypress Park Dr
- 4671 Cypress Park Dr
- 105 First St
- 4131 Millstone Park Ln
- Jade I Plan at The Grove At Mundy Mill
- Jasmine Plan at The Grove At Mundy Mill
- Jade II Plan at The Grove At Mundy Mill
- 4840 Orchard Grove Way Unit 174
- 3525 Westgate Dr
- 3139 Buice Cir
- 3129 Buice Cir
- 3134 Buice Cir
- 3125 Buice Cir
- 3140 Buice Cir
- 3128 Buice Cir
- 3244 Roper Ln Unit 12
- 2955 Drew Valley Cir
- 2949 Drew Valley Cir
- 2942 Drew Valley St
- 3242 Roper Ln
- 2949 Drew Valley Cir
- 3122 Buice Cir
- 0 Drew Valley St Unit 7082985
- 0 Drew Valley St Unit 7079244
- 0 Drew Valley St Unit 8815246
- 3119 Buice Cir
- 3240 Roper Ln Unit 12
- 3029 Buice Ln Unit 23
- 3029 Buice Ln