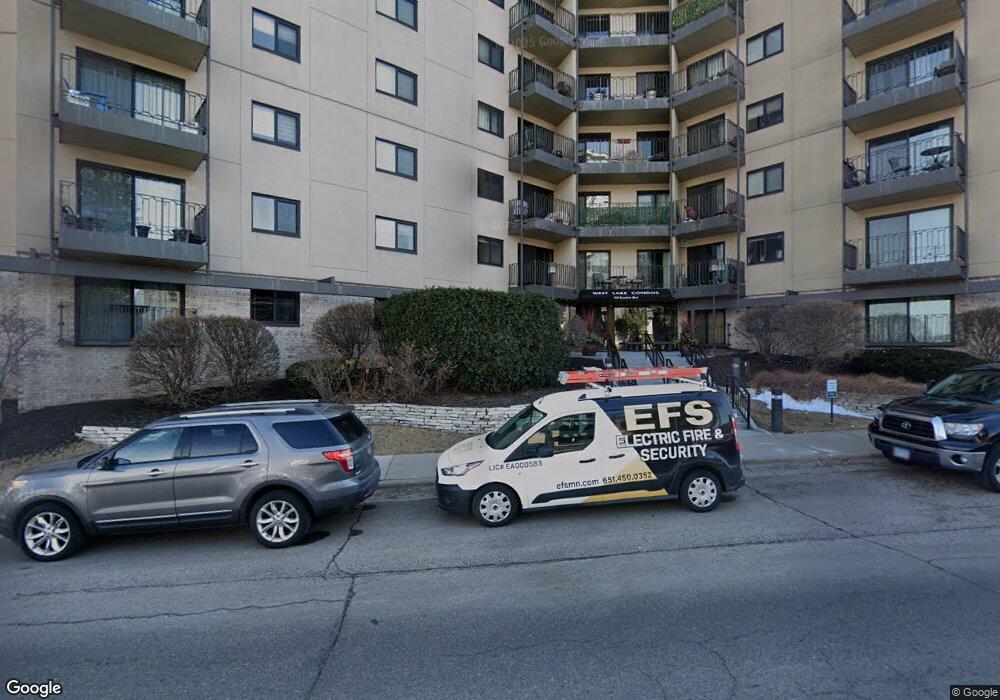
3131 Excelsior Blvd Unit 813 Minneapolis, MN 55416
West Maka Ska NeighborhoodEstimated Value: $277,000 - $313,000
2
Beds
2
Baths
1,133
Sq Ft
$258/Sq Ft
Est. Value
About This Home
This home is located at 3131 Excelsior Blvd Unit 813, Minneapolis, MN 55416 and is currently estimated at $292,872, approximately $258 per square foot. 3131 Excelsior Blvd Unit 813 is a home located in Hennepin County with nearby schools including Kenwood Elementary School, Anwatin Middle School, and North High School.
Ownership History
Date
Name
Owned For
Owner Type
Purchase Details
Closed on
Sep 29, 2022
Sold by
Thompson Kyle David
Bought by
Mirzamohammadi Parviz and Mirzasafi Monir
Current Estimated Value
Purchase Details
Closed on
Jun 14, 2018
Sold by
Thompson Stephen John and Thompson Noreen Walen
Bought by
Thompson Kyle David
Purchase Details
Closed on
Jul 25, 2012
Sold by
Wilmington Trust Company
Bought by
Thompson Noreen Walen and Thompson Stephen John
Purchase Details
Closed on
Sep 29, 2011
Sold by
Citimortgage Inc
Bought by
Wilmington Trust Company
Purchase Details
Closed on
Sep 15, 2011
Sold by
Donna M Boostrom
Bought by
Citimortgage Inc
Purchase Details
Closed on
Oct 2, 2003
Sold by
Turnstone Calhoun Llc
Bought by
Boostrom Donna M
Purchase Details
Closed on
Oct 1, 2003
Sold by
Turnstone Calhoun Llc
Bought by
Moran Patrick J
Create a Home Valuation Report for This Property
The Home Valuation Report is an in-depth analysis detailing your home's value as well as a comparison with similar homes in the area
Home Values in the Area
Average Home Value in this Area
Purchase History
| Date | Buyer | Sale Price | Title Company |
|---|---|---|---|
| Mirzamohammadi Parviz | $275,000 | Executive Title | |
| Thompson Kyle David | -- | None Available | |
| Thompson Noreen Walen | $156,500 | None Available | |
| Wilmington Trust Company | -- | None Available | |
| Citimortgage Inc | $175,727 | -- | |
| Citimortgage Inc | $175,726 | None Available | |
| Boostrom Donna M | $231,300 | -- | |
| Moran Patrick J | $187,000 | -- |
Source: Public Records
Tax History
| Year | Tax Paid | Tax Assessment Tax Assessment Total Assessment is a certain percentage of the fair market value that is determined by local assessors to be the total taxable value of land and additions on the property. | Land | Improvement |
|---|---|---|---|---|
| 2024 | $6,095 | $279,000 | $14,000 | $265,000 |
| 2023 | $5,646 | $283,000 | $14,000 | $269,000 |
| 2022 | $5,704 | $292,000 | $14,000 | $278,000 |
| 2021 | $5,349 | $281,000 | $14,000 | $267,000 |
| 2020 | $5,632 | $265,000 | $8,800 | $256,200 |
| 2019 | $5,583 | $265,000 | $8,800 | $256,200 |
| 2018 | $5,552 | $255,000 | $8,800 | $246,200 |
| 2017 | $5,378 | $236,000 | $8,800 | $227,200 |
| 2016 | $5,292 | $224,500 | $8,800 | $215,700 |
| 2015 | $5,122 | $206,000 | $8,800 | $197,200 |
| 2014 | -- | $186,500 | $8,800 | $177,700 |
Source: Public Records
Map
Nearby Homes
- 3131 Excelsior Blvd Unit 412
- 3402 W 32nd St
- 3400 List Place Unit 1
- 3400 List Place Unit 3
- 3150 Excelsior Blvd Unit 405
- 3150 Excelsior Blvd Unit 313
- 3150 Excelsior Blvd Unit 211
- 3150 Excelsior Blvd Unit 101
- 3150 Excelsior Blvd Unit 207
- 3128 W Bde Maka Ska Blvd Unit 417
- 3136 W Bde Maka Ska Blvd Unit 201
- 3128 W Bde Maka Ska Blvd Unit 415
- 3433 Saint Louis Ave
- 3810 W 31st St Unit 101
- 3104 W Lake St Unit 412
- 3104 W Lake St Unit 306
- 3104 W Lake St Unit 405
- 3116 W Lake St Unit 413
- 3408 Zenith Ave S
- 3316 W 34 1 2 St
- 3131 Excelsior Blvd Unit 806
- 3131 Excelsior Blvd Unit 913
- 3131 Excelsior Blvd Unit 912
- 3131 Excelsior Blvd Unit 911
- 3131 Excelsior Blvd Unit 910
- 3131 Excelsior Blvd Unit 909
- 3131 Excelsior Blvd Unit 908
- 3131 Excelsior Blvd Unit 907
- 3131 Excelsior Blvd Unit 906
- 3131 Excelsior Blvd Unit 905
- 3131 Excelsior Blvd Unit 904
- 3131 Excelsior Blvd Unit 902
- 3131 Excelsior Blvd Unit 901
- 3131 Excelsior Blvd Unit 812
- 3131 Excelsior Blvd Unit 811
- 3131 Excelsior Blvd Unit 810
- 3131 Excelsior Blvd Unit 809
- 3131 Excelsior Blvd Unit 808
- 3131 Excelsior Blvd Unit 807
- 3131 Excelsior Blvd Unit 803
Your Personal Tour Guide
Ask me questions while you tour the home.