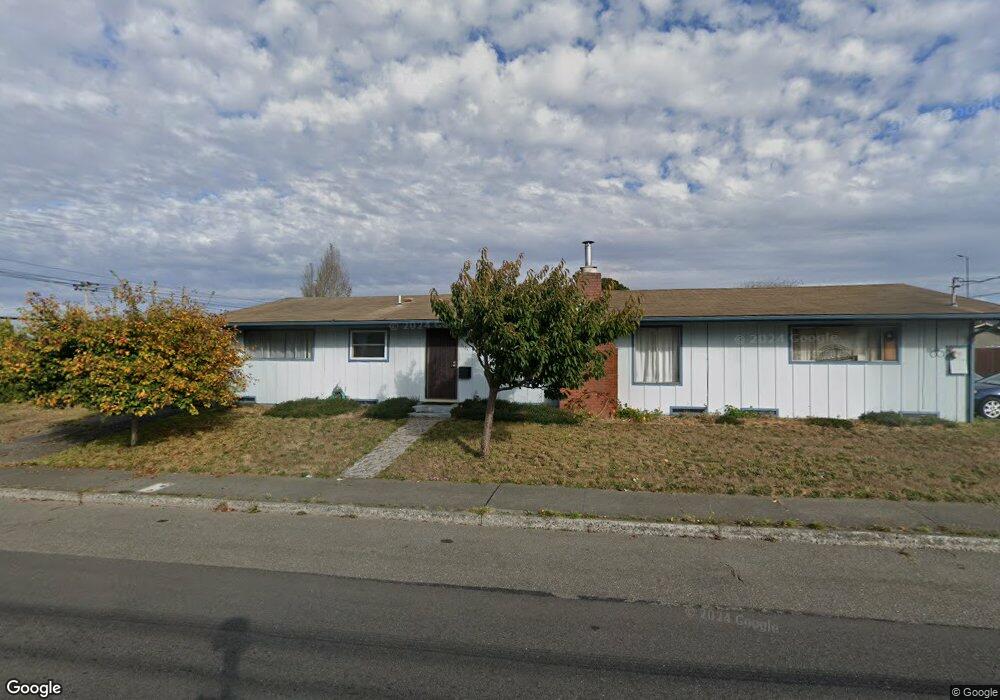
3131 Union St Eureka, CA 95503
Rosewood NeighborhoodEstimated Value: $335,443 - $383,000
3
Beds
2
Baths
1,533
Sq Ft
$234/Sq Ft
Est. Value
About This Home
This home is located at 3131 Union St, Eureka, CA 95503 and is currently estimated at $359,111, approximately $234 per square foot. 3131 Union St is a home located in Humboldt County with nearby schools including Alice Birney Elementary School, Winship Middle School, and Eureka Senior High School.
Ownership History
Date
Name
Owned For
Owner Type
Purchase Details
Closed on
Mar 11, 2014
Sold by
Mace Catherine
Bought by
Mace Catherine Monroe and Monroe Mace 2014 Living Trust
Current Estimated Value
Purchase Details
Closed on
Jan 24, 2014
Sold by
Monroe Thomas H
Bought by
Monroe Thomas H and Monroe Family Trust
Purchase Details
Closed on
Mar 30, 2011
Sold by
Wilson Patricia Elaine
Bought by
Monroe Thomas H
Home Financials for this Owner
Home Financials are based on the most recent Mortgage that was taken out on this home.
Original Mortgage
$131,125
Interest Rate
4.72%
Mortgage Type
New Conventional
Purchase Details
Closed on
Mar 16, 1999
Sold by
Wilson Barry G
Bought by
Wilson Patricia Elaine
Create a Home Valuation Report for This Property
The Home Valuation Report is an in-depth analysis detailing your home's value as well as a comparison with similar homes in the area
Home Values in the Area
Average Home Value in this Area
Purchase History
| Date | Buyer | Sale Price | Title Company |
|---|---|---|---|
| Mace Catherine Monroe | -- | None Available | |
| Mace Catherine Monroe | -- | None Available | |
| Monroe Thomas H | -- | None Available | |
| Monroe Thomas H | $175,000 | Humboldt Land Title Company | |
| Wilson Patricia Elaine | -- | -- |
Source: Public Records
Mortgage History
| Date | Status | Borrower | Loan Amount |
|---|---|---|---|
| Previous Owner | Monroe Thomas H | $131,125 |
Source: Public Records
Tax History
| Year | Tax Paid | Tax Assessment Tax Assessment Total Assessment is a certain percentage of the fair market value that is determined by local assessors to be the total taxable value of land and additions on the property. | Land | Improvement |
|---|---|---|---|---|
| 2025 | $2,306 | $224,196 | $115,302 | $108,894 |
| 2024 | $2,306 | $219,801 | $113,042 | $106,759 |
| 2023 | $2,273 | $215,492 | $110,826 | $104,666 |
| 2022 | $2,360 | $211,267 | $108,653 | $102,614 |
| 2021 | $2,210 | $207,125 | $106,523 | $100,602 |
| 2020 | $2,194 | $205,002 | $105,431 | $99,571 |
| 2019 | $2,149 | $200,983 | $103,364 | $97,619 |
| 2018 | $2,116 | $197,043 | $101,338 | $95,705 |
| 2017 | $2,106 | $193,180 | $99,351 | $93,829 |
| 2016 | $2,106 | $189,393 | $97,403 | $91,990 |
| 2015 | $2,087 | $186,549 | $95,940 | $90,609 |
| 2014 | $1,952 | $182,896 | $94,061 | $88,835 |
Source: Public Records
Map
Nearby Homes
Your Personal Tour Guide
Ask me questions while you tour the home.