3131 Valley Forge Dr Stockton, CA 95209
Colonial Heights NeighborhoodEstimated Value: $437,000 - $496,000
About This Home
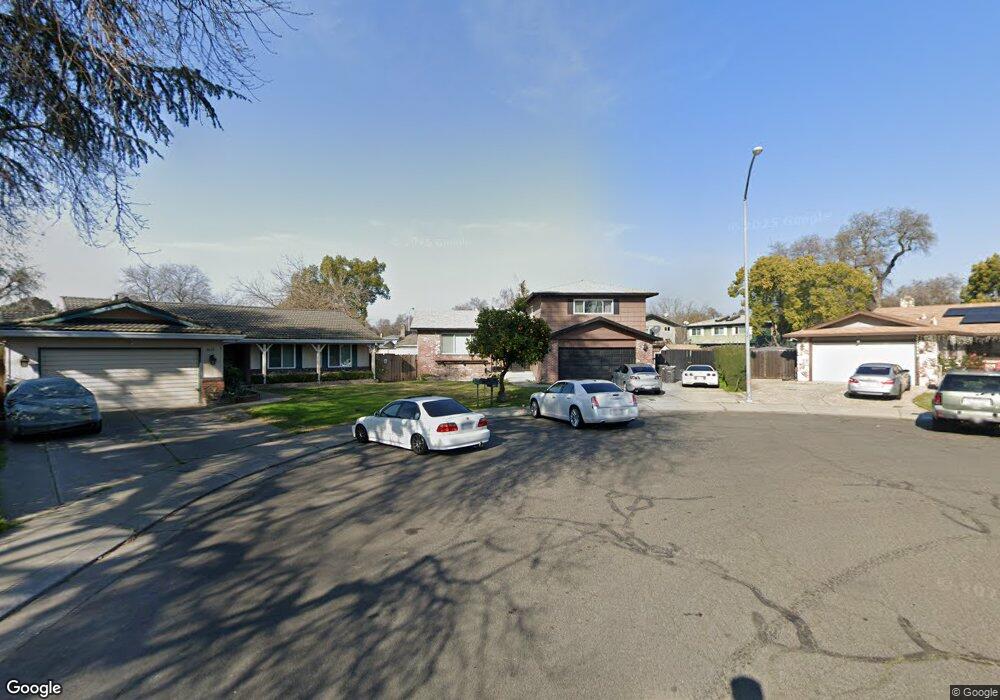
This home is located at 3131 Valley Forge Dr, Stockton, CA 95209 and is currently estimated at $480,475, approximately $235 per square foot. 3131 Valley Forge Dr is a home located in San Joaquin County with nearby schools including Wagner-Holt Elementary School, Delta Sierra Middle School, and Bear Creek High School.
Ownership History
We collect this data history from publicly available records. To have your information removed, we recommend requesting removal directly through your county’s website.
Purchase Details
Purchase Details
Home Financials for this Owner
Home Financials are based on the most recent Mortgage that was taken out on this home.Purchase Details
Home Financials for this Owner
Home Financials are based on the most recent Mortgage that was taken out on this home.Purchase Details
Home Values in the Area
Average Home Value in this Area
Purchase History
We collect this data history from publicly available records. To have your information removed, we recommend requesting removal directly through your county’s website.
| Date | Buyer | Sale Price | Title Company |
|---|---|---|---|
| -- | None Available | ||
| $220,000 | Title Court Service | ||
| -- | Chicago Title Co | ||
| -- | -- |
Mortgage History
We collect this data history from publicly available records. To have your information removed, we recommend requesting removal directly through your county’s website.
| Date | Status | Borrower | Loan Amount |
|---|---|---|---|
| Open | $176,000 | ||
| Previous Owner | $105,000 |
Tax History
We collect this data history from publicly available records. To have your information removed, we recommend requesting removal directly through your county’s website.
| Year | Tax Paid | Tax Assessment Tax Assessment Total Assessment is a certain percentage of the fair market value that is determined by local assessors to be the total taxable value of land and additions on the property. | Land | Improvement |
|---|---|---|---|---|
| 2025 | $4,162 | $318,610 | $95,582 | $223,028 |
| 2024 | $5,479 | $312,363 | $93,708 | $218,655 |
| 2023 | $5,523 | $306,239 | $91,871 | $214,368 |
| 2022 | $3,400 | $300,235 | $90,070 | $210,165 |
| 2021 | $3,480 | $294,349 | $88,304 | $206,045 |
| 2020 | $3,396 | $291,332 | $87,399 | $203,933 |
| 2019 | $3,318 | $285,621 | $85,686 | $199,935 |
| 2018 | $3,259 | $280,021 | $84,006 | $196,015 |
| 2017 | $3,182 | $274,531 | $82,359 | $192,172 |
| 2016 | $2,997 | $269,150 | $80,745 | $188,405 |
| 2014 | $2,624 | $237,000 | $71,000 | $166,000 |
Map
- 3025 Monticello Dr
- 8356 Hamilton Way
- 8228 Richland Way
- 8003 Independence Ave
- 8348 Edgefield Way
- 8667 Mariners Dr Unit 57
- 8667 Mariners Dr Unit 83
- 9214 Bainbridge Place
- 3415 Admiral Dr
- 9214 Darby Ct
- 4123 Estate Dr
- 2573 Bunkerhill Dr
- 3833 Rion Way
- 9531 Bancroft Way
- 7449 Karlsberg Cir
- 9561 Kelley Dr
- 7348 Lighthouse Dr
- 2715 Stanfield Dr
- 7308 Lighthouse Dr
- 7329 Kelley Dr
- 3137 Valley Forge Dr
- 3125 Valley Forge Dr
- 8550 Woodhaven Way
- 8558 Woodhaven Way
- 8542 Woodhaven Way
- 3158 W Creek Dr
- 3172 W Creek Dr
- 3143 Valley Forge Dr
- 3149 Valley Forge Dr
- 3119 Valley Forge Dr
- 3207 Valley Forge Dr
- 3144 W Creek Dr
- 8534 Woodhaven Way
- 3113 Valley Forge Dr
- 3130 W Creek Dr
- 3107 Valley Forge Dr
- 3213 Valley Forge Dr
- 8553 Woodhaven Way
- 8559 Woodhaven Way
- 8526 Woodhaven Way
Ask me questions while you tour the home.