Estimated Value: $489,000 - $690,000
4
Beds
3
Baths
2,327
Sq Ft
$270/Sq Ft
Est. Value
About This Home
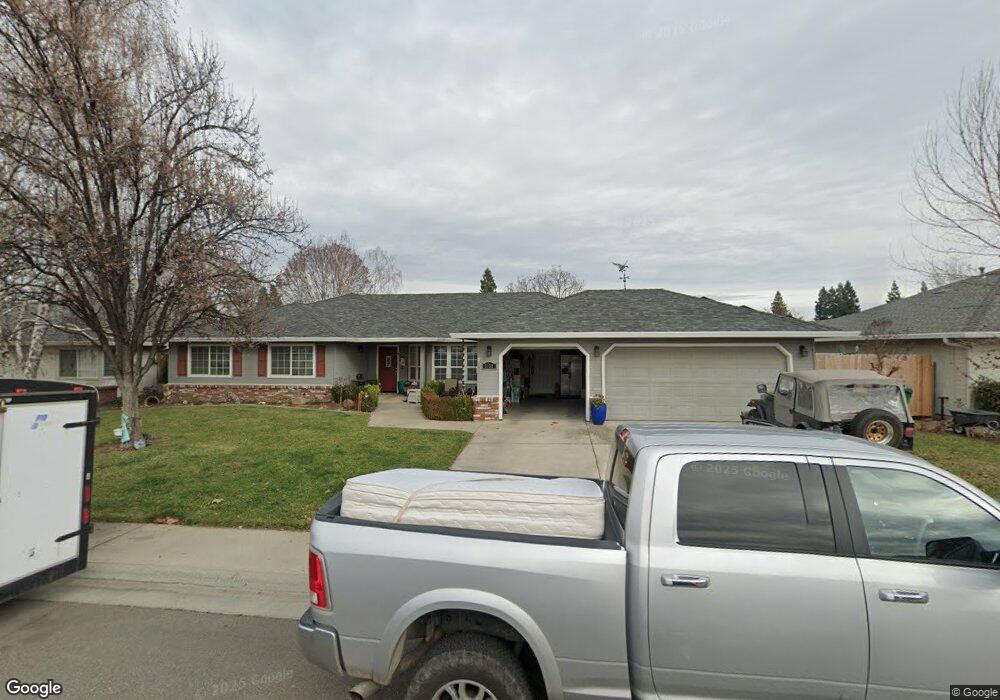
This home is located at 3132 Caribou Ct, Chico, CA 95973 and is currently estimated at $627,333, approximately $269 per square foot. 3132 Caribou Ct is a home located in Butte County with nearby schools including Shasta Elementary School, Bidwell Junior High School, and Pleasant Valley High School.
Ownership History
Date
Name
Owned For
Owner Type
Purchase Details
Closed on
Nov 18, 2020
Sold by
Rader Timothy P and Rader Laurene G
Bought by
Timothy Paul Rader and Timothy Laurene Grace
Current Estimated Value
Home Financials for this Owner
Home Financials are based on the most recent Mortgage that was taken out on this home.
Original Mortgage
$324,750
Outstanding Balance
$286,996
Interest Rate
2.8%
Mortgage Type
New Conventional
Estimated Equity
$340,337
Purchase Details
Closed on
Sep 15, 2020
Sold by
Rader Timothy P and Rader Laurene G
Bought by
Rader Timothy Paul and Rader Laurene Grace
Purchase Details
Closed on
Jul 20, 2000
Sold by
Webb Homes
Bought by
Rader Timothy P and Rader Laurene G
Home Financials for this Owner
Home Financials are based on the most recent Mortgage that was taken out on this home.
Original Mortgage
$175,550
Interest Rate
8.2%
Create a Home Valuation Report for This Property
The Home Valuation Report is an in-depth analysis detailing your home's value as well as a comparison with similar homes in the area
Purchase History
| Date | Buyer | Sale Price | Title Company |
|---|---|---|---|
| Timothy Paul Rader | -- | New Title Company Name | |
| Rader Timothy P | -- | New Title Company Name | |
| Rader Timothy Paul | -- | None Available | |
| Rader Timothy P | $219,500 | Mid Valley Title & Escrow Co |
Source: Public Records
Mortgage History
| Date | Status | Borrower | Loan Amount |
|---|---|---|---|
| Open | Rader Timothy P | $324,750 | |
| Previous Owner | Rader Timothy P | $175,550 | |
| Closed | Rader Timothy P | $32,900 |
Source: Public Records
Tax History
| Year | Tax Paid | Tax Assessment Tax Assessment Total Assessment is a certain percentage of the fair market value that is determined by local assessors to be the total taxable value of land and additions on the property. | Land | Improvement |
|---|---|---|---|---|
| 2025 | $3,963 | $364,302 | $85,874 | $278,428 |
| 2024 | $3,963 | $357,160 | $84,191 | $272,969 |
| 2023 | $3,915 | $350,158 | $82,541 | $267,617 |
| 2022 | $3,852 | $343,293 | $80,923 | $262,370 |
| 2021 | $3,778 | $336,563 | $79,337 | $257,226 |
| 2020 | $3,767 | $333,113 | $78,524 | $254,589 |
| 2019 | $3,698 | $326,583 | $76,985 | $249,598 |
| 2018 | $3,630 | $320,180 | $75,476 | $244,704 |
| 2017 | $3,556 | $313,903 | $73,997 | $239,906 |
| 2016 | $3,243 | $307,749 | $72,547 | $235,202 |
| 2015 | $3,243 | $303,128 | $71,458 | $231,670 |
| 2014 | $3,166 | $297,191 | $70,059 | $227,132 |
Source: Public Records
Map
Nearby Homes
- 3134 Lake Mead Ct
- 156 Greenfield Dr
- 213 Denali Dr
- 338 Royal Glen Ln
- 115 Brookvine Cir
- 529 Countryside Ln
- 2947 Carlene Place
- 199 E Shasta Ave
- 3156 Esplanade Unit 293
- 3156 Esplanade Unit 228
- 3156 Esplanade Unit 300
- 3156 Esplanade Unit 207
- 3070 Snowbird Dr
- 294 Saint Michael Ct Unit A
- 455 Cimarron Dr
- 26 Northwood Commons Place
- 370 E Lassen Ave Unit 15
- 457 Henshaw Ave
- 356 Chestnut Rose Ln
- 493 Autumn Gold Dr
- 3152 Caribou Ct
- 3116 Caribou Ct
- 266 Mill Creek Dr
- 3101 Lake Mead Ct
- 3170 Caribou Ct
- 3119 Lake Mead Ct
- 3133 Caribou Ct
- 3115 Caribou Ct
- 3153 Caribou Ct
- 3171 Caribou Ct
- 287 Mill Creek Dr
- 3135 Lake Mead Ct
- 3100 Lake Mead Ct
- 271 Mill Creek Dr
- 3186 Caribou Ct
- 234 Mill Creek Dr
- 3130 Vicksburg Ct
- 255 Mill Creek Dr
- 315 Mill Creek Dr
- 3114 Vicksburg Ct
Your Personal Tour Guide
Ask me questions while you tour the home.