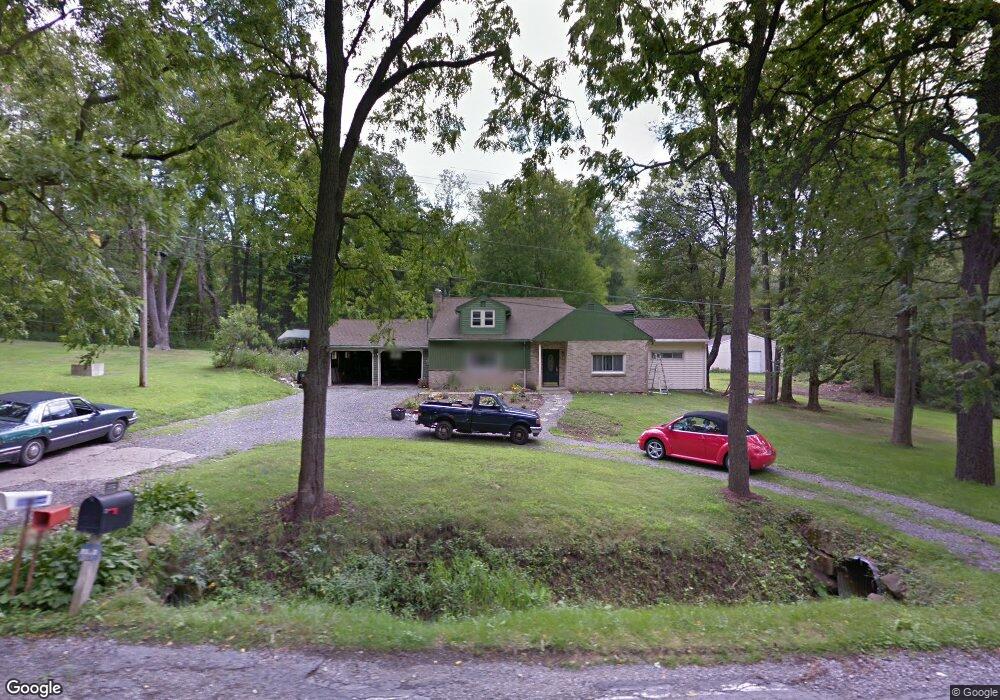
3132 Five Points Hartford Rd Fowler, OH 44418
Estimated Value: $335,928 - $366,000
5
Beds
2
Baths
2,757
Sq Ft
$125/Sq Ft
Est. Value
About This Home
This home is located at 3132 Five Points Hartford Rd, Fowler, OH 44418 and is currently estimated at $344,232, approximately $124 per square foot. 3132 Five Points Hartford Rd is a home located in Trumbull County with nearby schools including Badger Elementary School, Badger Middle School, and Badger High School.
Ownership History
Date
Name
Owned For
Owner Type
Purchase Details
Closed on
Dec 28, 2009
Sold by
Suverison Jeffery
Bought by
Kellogg Thomas M and Kellogg Patricia A
Current Estimated Value
Home Financials for this Owner
Home Financials are based on the most recent Mortgage that was taken out on this home.
Original Mortgage
$87,000
Outstanding Balance
$56,921
Interest Rate
4.96%
Mortgage Type
New Conventional
Estimated Equity
$287,311
Purchase Details
Closed on
Dec 23, 2009
Sold by
Suverison Claudia J
Bought by
Kellogg Thomas M and Kellogg Patricia A
Home Financials for this Owner
Home Financials are based on the most recent Mortgage that was taken out on this home.
Original Mortgage
$87,000
Outstanding Balance
$56,921
Interest Rate
4.96%
Mortgage Type
New Conventional
Estimated Equity
$287,311
Purchase Details
Closed on
Jan 1, 1990
Bought by
Lyle B Suverison
Create a Home Valuation Report for This Property
The Home Valuation Report is an in-depth analysis detailing your home's value as well as a comparison with similar homes in the area
Home Values in the Area
Average Home Value in this Area
Purchase History
| Date | Buyer | Sale Price | Title Company |
|---|---|---|---|
| Kellogg Thomas M | -- | Attorney | |
| Kellogg Thomas M | $132,000 | Attorney | |
| Lyle B Suverison | -- | -- |
Source: Public Records
Mortgage History
| Date | Status | Borrower | Loan Amount |
|---|---|---|---|
| Open | Kellogg Thomas M | $87,000 |
Source: Public Records
Tax History Compared to Growth
Tax History
| Year | Tax Paid | Tax Assessment Tax Assessment Total Assessment is a certain percentage of the fair market value that is determined by local assessors to be the total taxable value of land and additions on the property. | Land | Improvement |
|---|---|---|---|---|
| 2024 | $3,506 | $79,840 | $11,310 | $68,530 |
| 2023 | $3,506 | $79,840 | $11,310 | $68,530 |
| 2022 | $2,927 | $60,240 | $10,290 | $49,950 |
| 2021 | $2,928 | $60,240 | $10,290 | $49,950 |
| 2020 | $2,948 | $60,240 | $10,290 | $49,950 |
| 2019 | $2,754 | $52,960 | $9,520 | $43,440 |
| 2018 | $2,760 | $52,960 | $9,520 | $43,440 |
| 2017 | $2,754 | $52,960 | $9,520 | $43,440 |
| 2016 | $2,303 | $44,560 | $9,520 | $35,040 |
| 2015 | $2,213 | $44,560 | $9,520 | $35,040 |
| 2014 | $2,212 | $44,560 | $9,520 | $35,040 |
| 2013 | $2,321 | $44,560 | $9,520 | $35,040 |
Source: Public Records
Map
Nearby Homes
- 3164 Ohio 7
- 7131 Drake Stateline Rd NE
- 7155 Drake State Line Rd
- 2486 Waynewood Dr NE
- 7974 Thompson Sharpsville Rd
- 8038 Thompson Sharpsville Rd
- 1921 Custer Orangeville Rd
- 2728 Sodom Hutchings Rd
- 4016 State Route 7
- 0 Albright McKay Rd NE
- 8274 Thompson Sharpsville Rd
- 2009 Sodom Hutchings Rd NE
- 4875 Cadwallader-Sonk Rd
- 1212 State Route 7 NE
- 1565 Sodom Hutchings Rd NE
- 209 Wyngate Dr
- 1555 Sodom Hutchings Rd NE
- 2601 Orangeville Rd
- 2701 Orangeville Rd
- 6333 Warren Sharon Rd
- 3147 Five Point
- 3188 Five Points Hartford Rd
- 3191 Five Points Hartford Rd
- 5 Points Point
- 3241 Five Points Hartford Rd
- 3031 Five Points Hartford Rd
- 3255 Five Points Hartford Rd
- 6365 Thompson Sharpsville Rd
- 3290 Five Points Hartford Rd
- 6397 Thompson Sharpsville Rd
- 3287 Five Points Hartford Rd
- 3307 Five Points Hartford Rd
- 6429 Thompson Sharpsville Rd
- 2590 Five Point
- 3327 Five Points Hartford Rd
- 6465 Thompson Sharpsville Rd
- 2656 Bushnell Campbell Rd
- 0 5 Points Hartford Rd
- 2800 Bushnell Campbell Rd
- 2795 Five Points Hartford Rd