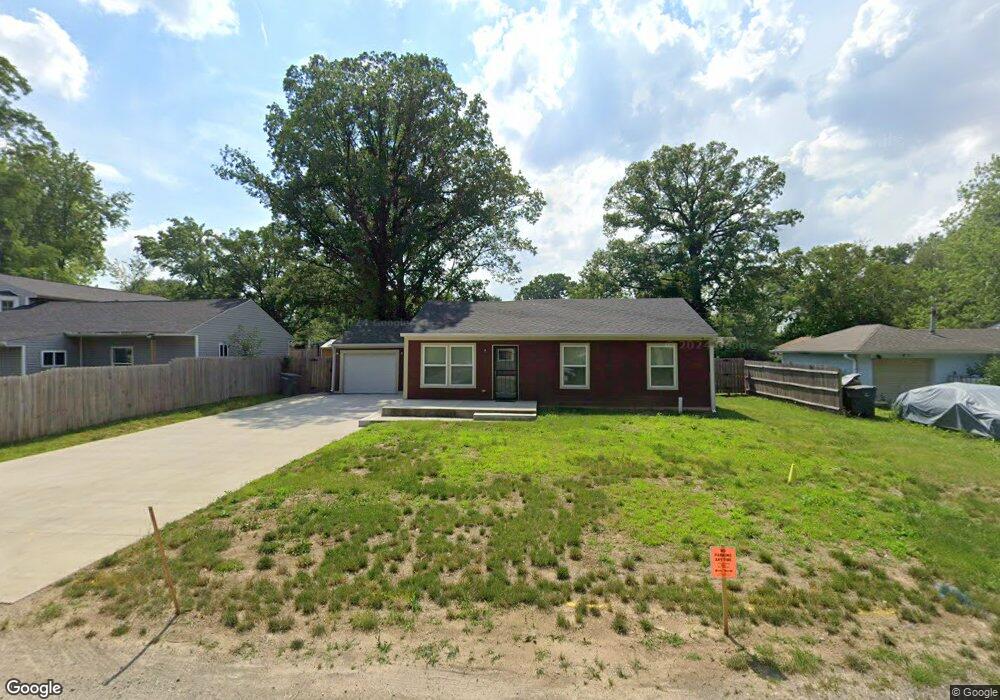
3132 N Campbell Ave Indianapolis, IN 46218
Arlington Woods NeighborhoodEstimated Value: $124,000 - $187,000
3
Beds
1
Bath
1,458
Sq Ft
$100/Sq Ft
Est. Value
About This Home
This home is located at 3132 N Campbell Ave, Indianapolis, IN 46218 and is currently estimated at $146,511, approximately $100 per square foot. 3132 N Campbell Ave is a home located in Marion County with nearby schools including Arlington Woods Elementary School No. 99, Thomas D. Gregg School No. 15, and Washington Irving School 14.
Ownership History
Date
Name
Owned For
Owner Type
Purchase Details
Closed on
Aug 18, 2020
Sold by
Day & Mannz Services Llc
Bought by
Days Property Group Llc
Current Estimated Value
Purchase Details
Closed on
Aug 13, 2020
Sold by
Day & Mannz Services Llc
Bought by
Days Property Group Llc
Purchase Details
Closed on
Jul 18, 2017
Sold by
Williams Rebekah Leigh
Bought by
Day Shamar
Purchase Details
Closed on
Feb 3, 2017
Sold by
Marion County Board Of Commissioners
Bought by
Williams Rebekah
Purchase Details
Closed on
Feb 2, 2017
Sold by
Marion County Auditor
Bought by
Marion County
Purchase Details
Closed on
Nov 17, 2010
Sold by
Hsbc Bank Usa National Association
Bought by
Dnr Llc
Purchase Details
Closed on
Oct 5, 2010
Sold by
Hicks Peggie
Bought by
Hsbc Bank Usa National Association
Purchase Details
Closed on
Oct 31, 2006
Sold by
D&L Management Llc
Bought by
Hicks Peggie
Home Financials for this Owner
Home Financials are based on the most recent Mortgage that was taken out on this home.
Original Mortgage
$42,400
Interest Rate
6.38%
Mortgage Type
New Conventional
Create a Home Valuation Report for This Property
The Home Valuation Report is an in-depth analysis detailing your home's value as well as a comparison with similar homes in the area
Home Values in the Area
Average Home Value in this Area
Purchase History
| Date | Buyer | Sale Price | Title Company |
|---|---|---|---|
| Days Property Group Llc | -- | None Available | |
| Days Property Group Llc | -- | None Listed On Document | |
| Day Shamar | $7,500 | -- | |
| Day & Mannz Services Llc | $7,500 | -- | |
| Williams Rebekah | $7,200 | -- | |
| Marion County | $13,173 | -- | |
| Dnr Llc | -- | None Available | |
| Hsbc Bank Usa National Association | $14,900 | None Available | |
| Hicks Peggie | -- | None Available |
Source: Public Records
Mortgage History
| Date | Status | Borrower | Loan Amount |
|---|---|---|---|
| Previous Owner | Hicks Peggie | $42,400 |
Source: Public Records
Tax History Compared to Growth
Tax History
| Year | Tax Paid | Tax Assessment Tax Assessment Total Assessment is a certain percentage of the fair market value that is determined by local assessors to be the total taxable value of land and additions on the property. | Land | Improvement |
|---|---|---|---|---|
| 2024 | $1,020 | $40,900 | $6,200 | $34,700 |
| 2023 | $1,020 | $39,300 | $6,200 | $33,100 |
| 2022 | $986 | $38,100 | $6,200 | $31,900 |
| 2021 | $901 | $35,400 | $6,200 | $29,200 |
| 2020 | $872 | $34,100 | $5,200 | $28,900 |
| 2019 | $905 | $34,900 | $5,200 | $29,700 |
| 2018 | $4,449 | $35,700 | $5,200 | $30,500 |
| 2017 | $517 | $35,600 | $5,200 | $30,400 |
| 2016 | $1,665 | $34,900 | $5,200 | $29,700 |
| 2014 | $319 | $56,000 | $5,200 | $50,800 |
| 2013 | $417 | $63,700 | $5,200 | $58,500 |
Source: Public Records
Map
Nearby Homes
- 3216 N Arlington Ave
- 3257 N Campbell Ave
- 5776 E 33rd St
- 3121 N Lesley Ave
- 6005 Massachusetts Ave
- 3152 N Lesley Ave
- 3454 N Lesley Ave
- 3712 N Graham Ave
- 3732 N Graham Ave
- 5448 E 30th St
- 3506 N Lesley Ave
- 3561 N Graham Ave
- 5415 E 34th St
- 3644 N Priscilla Ct
- 3701 N Audubon Rd
- 3614 N Whittier Place
- 2437 N Webster Ave
- 6231 E 25th St
- 2422 N Arlington Ave
- 3536 N Hawthorne Ln
- 3126 N Campbell Ave
- 3138 N Campbell Ave
- 3135 N Bolton Ave
- 3120 N Campbell Ave
- 3144 N Campbell Ave
- 3141 N Bolton Ave
- 3129 N Bolton Ave
- 3129 N Bolton Ave Unit 2346485-1374
- 3133 N Campbell Ave
- 3139 N Campbell Ave
- 3127 N Campbell Ave
- 3123 N Bolton Ave
- 3123 N Bolton Ave Unit 2346484-1374
- 3147 N Bolton Ave
- 3114 N Campbell Ave
- 5901 E 32nd St
- 3121 N Campbell Ave
- 3204 N Campbell Ave
- 3117 N Bolton Ave
- 3201 N Bolton Ave