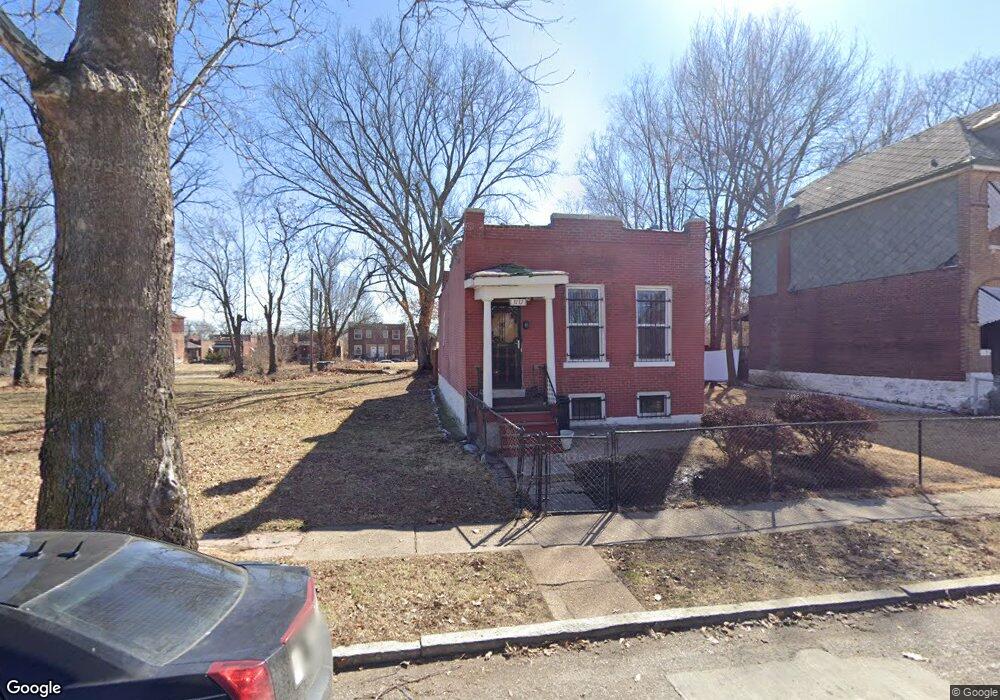
3132 New Ashland Place Saint Louis, MO 63115
Greater Ville NeighborhoodEstimated Value: $39,000 - $43,543
--
Bed
1
Bath
1,876
Sq Ft
$22/Sq Ft
Est. Value
About This Home
This home is located at 3132 New Ashland Place, Saint Louis, MO 63115 and is currently estimated at $40,848, approximately $21 per square foot. 3132 New Ashland Place is a home located in St. Louis City with nearby schools including Hickey Elementary School, Sumner High School, and Emerson Academy Therapeutic School.
Ownership History
Date
Name
Owned For
Owner Type
Purchase Details
Closed on
Mar 31, 2016
Sold by
Hollins Khalil
Bought by
Hollins Brandi
Current Estimated Value
Purchase Details
Closed on
Mar 5, 2009
Sold by
Middlewest Properties Inc
Bought by
Hollins Khalil
Purchase Details
Closed on
Sep 26, 2008
Sold by
Hodge Edquina R
Bought by
Middlewest Properties Inc
Purchase Details
Closed on
Nov 30, 2006
Sold by
Hollins Khalil
Bought by
Middlewest Properties Inc
Home Financials for this Owner
Home Financials are based on the most recent Mortgage that was taken out on this home.
Original Mortgage
$18,468
Interest Rate
6.3%
Mortgage Type
Seller Take Back
Purchase Details
Closed on
Jun 8, 1998
Sold by
Florine Gause
Bought by
Reeves Starr Trynea
Home Financials for this Owner
Home Financials are based on the most recent Mortgage that was taken out on this home.
Original Mortgage
$24,750
Interest Rate
11.75%
Mortgage Type
Purchase Money Mortgage
Create a Home Valuation Report for This Property
The Home Valuation Report is an in-depth analysis detailing your home's value as well as a comparison with similar homes in the area
Home Values in the Area
Average Home Value in this Area
Purchase History
| Date | Buyer | Sale Price | Title Company |
|---|---|---|---|
| Hollins Brandi | -- | None Available | |
| Hollins Khalil | -- | None Available | |
| Hollins Khalil | -- | None Available | |
| Middlewest Properties Inc | -- | None Available | |
| Hodge Edquina R | -- | None Available | |
| Middlewest Properties Inc | -- | None Available | |
| Hollins Khalil | -- | None Available | |
| Reeves Starr Trynea | -- | First American Title |
Source: Public Records
Mortgage History
| Date | Status | Borrower | Loan Amount |
|---|---|---|---|
| Previous Owner | Hollins Khalil | $18,468 | |
| Previous Owner | Reeves Starr Trynea | $24,750 |
Source: Public Records
Tax History Compared to Growth
Tax History
| Year | Tax Paid | Tax Assessment Tax Assessment Total Assessment is a certain percentage of the fair market value that is determined by local assessors to be the total taxable value of land and additions on the property. | Land | Improvement |
|---|---|---|---|---|
| 2025 | $133 | $1,300 | $170 | $1,130 |
| 2024 | $128 | $1,260 | $170 | $1,090 |
| 2023 | $128 | $1,260 | $170 | $1,090 |
| 2022 | $129 | $1,220 | $170 | $1,050 |
| 2021 | $129 | $1,220 | $170 | $1,050 |
| 2020 | $128 | $1,220 | $170 | $1,050 |
| 2019 | $128 | $1,220 | $170 | $1,050 |
| 2018 | $121 | $1,100 | $170 | $930 |
| 2017 | $119 | $1,100 | $170 | $930 |
| 2016 | $143 | $1,370 | $380 | $990 |
| 2015 | $132 | $1,370 | $380 | $990 |
| 2014 | $137 | $1,370 | $380 | $990 |
| 2013 | -- | $1,440 | $380 | $1,060 |
Source: Public Records
Map
Nearby Homes
- 4275 E Ashland Ave
- 3130 Whittier St
- 4204 E Lexington Ave
- 3121 Fair Ave
- 4149 Labadie Ave
- 4200 E Labadie Ave
- 3119 N Sarah St
- 4153 E Lexington Ave
- 4196 Sacramento Ave
- 4219 E Sacramento Ave
- 4132 San Francisco Ave
- 4043 Palm St
- 4236 W Sacramento Ave
- 4027 Palm St
- 4059 Maffitt Ave
- 4003 Lexington Ave
- 2914 N Newstead Ave
- 2912 N Newstead Ave
- 4239 E Margaretta Ave
- 4017 Maffitt Ave
- 3128 New Ashland Place
- 3114 New Ashland Place
- 3127 Rolla Place
- 3125 Rolla Place
- 3129 Rolla Place
- 3123 Rolla Place
- 3131 Rolla Place
- 3119 Rolla Place
- 3133 Rolla Place
- 3117 Rolla Place
- 3131 New Ashland Place
- 3115 Rolla Place
- 3123 New Ashland Place
- 3121 New Ashland Place
- 3111 Rolla Place
- 3141 Rolla Place
- 3109 Rolla Place
- 3107 Rolla Place
- 3100 New Ashland Place
- 3101 Rolla Place