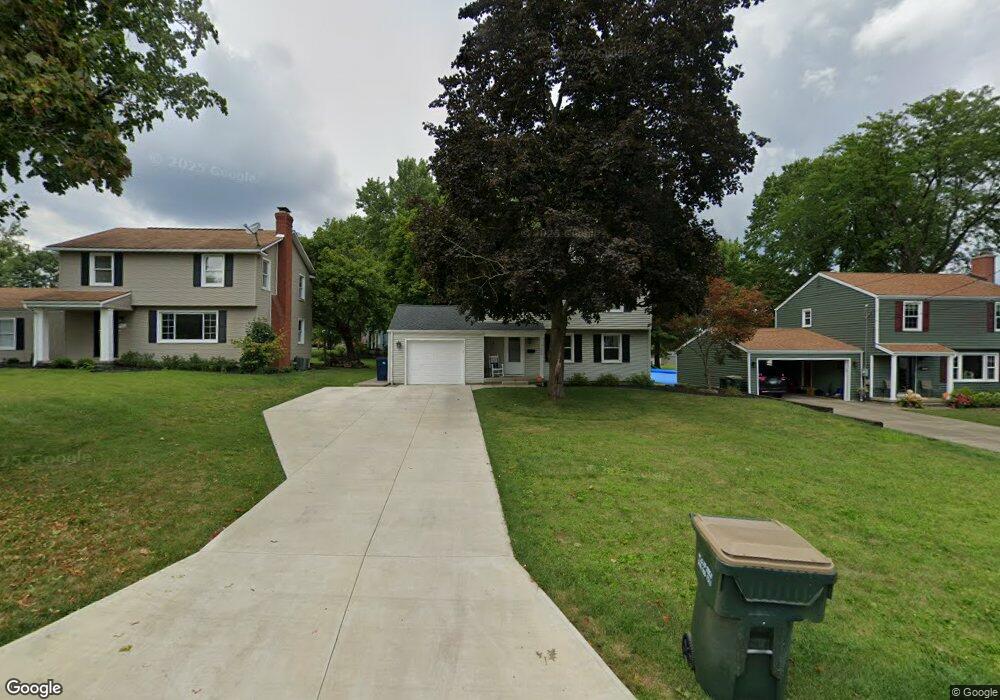
3132 Whittier Ct Youngstown, OH 44514
Estimated Value: $226,000 - $275,000
3
Beds
2
Baths
1,484
Sq Ft
$169/Sq Ft
Est. Value
About This Home
This home is located at 3132 Whittier Ct, Youngstown, OH 44514 and is currently estimated at $250,792, approximately $168 per square foot. 3132 Whittier Ct is a home located in Mahoning County with nearby schools including Poland Union Elementary School, Poland Middle School, and Poland Seminary High School.
Ownership History
Date
Name
Owned For
Owner Type
Purchase Details
Closed on
Oct 6, 2009
Sold by
Jarrett Eric S and Jarrett Joan
Bought by
Jackson Wendy and Marsico Richard P
Current Estimated Value
Home Financials for this Owner
Home Financials are based on the most recent Mortgage that was taken out on this home.
Original Mortgage
$108,007
Outstanding Balance
$70,599
Interest Rate
5.1%
Mortgage Type
FHA
Estimated Equity
$180,193
Purchase Details
Closed on
Oct 31, 2004
Sold by
80 For All Inc
Bought by
Varnell Matthew J and Varnell Heather M
Home Financials for this Owner
Home Financials are based on the most recent Mortgage that was taken out on this home.
Original Mortgage
$84,000
Interest Rate
4.7%
Mortgage Type
Purchase Money Mortgage
Purchase Details
Closed on
Oct 24, 2003
Sold by
Unk Admr/Exec/Execx Of Est Of Richard E
Bought by
80-For-All Inc
Purchase Details
Closed on
Nov 28, 1984
Bought by
Yozwick Richard E
Create a Home Valuation Report for This Property
The Home Valuation Report is an in-depth analysis detailing your home's value as well as a comparison with similar homes in the area
Home Values in the Area
Average Home Value in this Area
Purchase History
| Date | Buyer | Sale Price | Title Company |
|---|---|---|---|
| Jackson Wendy | $110,000 | Attorney | |
| Varnell Matthew J | $105,000 | -- | |
| 80-For-All Inc | $70,100 | -- | |
| Yozwick Richard E | -- | -- |
Source: Public Records
Mortgage History
| Date | Status | Borrower | Loan Amount |
|---|---|---|---|
| Open | Jackson Wendy | $108,007 | |
| Previous Owner | Varnell Matthew J | $84,000 | |
| Closed | Varnell Matthew J | $15,750 |
Source: Public Records
Tax History Compared to Growth
Tax History
| Year | Tax Paid | Tax Assessment Tax Assessment Total Assessment is a certain percentage of the fair market value that is determined by local assessors to be the total taxable value of land and additions on the property. | Land | Improvement |
|---|---|---|---|---|
| 2024 | $3,059 | $61,690 | $8,800 | $52,890 |
| 2023 | $2,989 | $61,690 | $8,800 | $52,890 |
| 2022 | $2,356 | $40,510 | $8,800 | $31,710 |
| 2021 | $2,249 | $40,510 | $8,800 | $31,710 |
| 2020 | $2,258 | $40,510 | $8,800 | $31,710 |
| 2019 | $2,048 | $33,570 | $8,800 | $24,770 |
| 2018 | $1,923 | $33,570 | $8,800 | $24,770 |
| 2017 | $1,887 | $33,570 | $8,800 | $24,770 |
| 2016 | $2,033 | $34,420 | $8,800 | $25,620 |
| 2015 | $1,990 | $34,420 | $8,800 | $25,620 |
| 2014 | $1,998 | $34,420 | $8,800 | $25,620 |
| 2013 | $1,972 | $34,420 | $8,800 | $25,620 |
Source: Public Records
Map
Nearby Homes
- 6666 Clingan Rd
- 6695 Clingan Rd Unit 24
- 6695 Clingan Rd Unit 32
- 6695 Clingan Rd Unit 10
- 6695 Clingan Rd Unit 4
- 2959 Holyoke Dr
- 6845 Katahdin Dr
- 2831 Center Rd
- 3327 Hampton Hall
- 3064 Howell Dr
- 2829 Poland Village Blvd
- 52 Greystone
- 3151 Heatherbrae Dr
- 2667 Center Rd
- 43 Greystone
- 6137 Acatello Place
- 2959 Algonquin Dr
- 7114 Garden Place Dr
- 2985 Algonquin Dr
- 20 Nesbitt St
- 3144 Whittier Ct
- 3118 Whittier Ct
- 3156 Whittier Ct
- 6665 Katahdin Dr
- 3168 Whittier Ct
- 6657 Katahdin Dr
- 3131 Whittier Ct
- 3143 Whittier Ct
- 3119 Whittier Ct
- 3155 Whittier Ct
- 3180 Whittier Ct
- 6686 Katahdin Dr
- 6674 Katahdin Dr
- 6647 Katahdin Dr
- 3167 Whittier Ct
- 6662 Katahdin Dr
- 6658 Clingan Rd
- 6710 Katahdin Dr
- 3192 Whittier Ct
- 3179 Whittier Ct