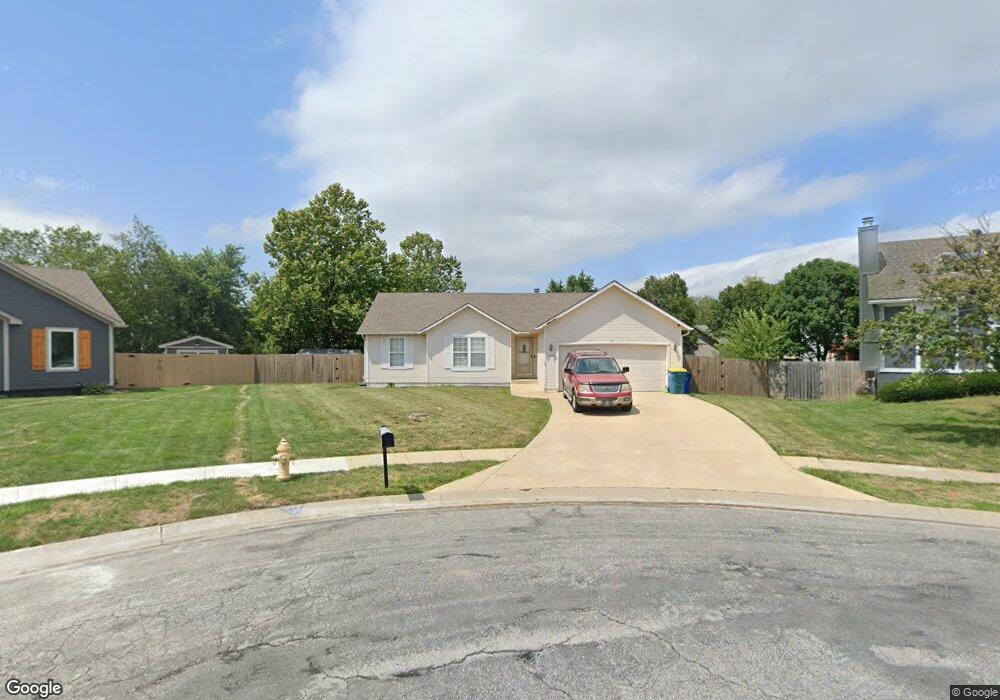
31340 W 173rd Terrace Gardner, KS 66030
Gardner-Edgerton NeighborhoodEstimated Value: $315,000 - $340,000
3
Beds
2
Baths
1,347
Sq Ft
$243/Sq Ft
Est. Value
About This Home
This home is located at 31340 W 173rd Terrace, Gardner, KS 66030 and is currently estimated at $327,501, approximately $243 per square foot. 31340 W 173rd Terrace is a home located in Johnson County with nearby schools including Madison Elementary School, Pioneer Ridge Middle School, and Gardner Edgerton High School.
Ownership History
Date
Name
Owned For
Owner Type
Purchase Details
Closed on
Feb 11, 2021
Sold by
Richardson Rutherford and Richardson Dawn M
Bought by
Richardson Blake Saner
Current Estimated Value
Purchase Details
Closed on
Jul 22, 2009
Sold by
Miller Gary D and Miller Gaybine F
Bought by
Davis Philip Edward and The Philip Edward Davis Jr Rev
Home Financials for this Owner
Home Financials are based on the most recent Mortgage that was taken out on this home.
Original Mortgage
$143,991
Outstanding Balance
$95,869
Interest Rate
5.71%
Mortgage Type
Purchase Money Mortgage
Estimated Equity
$231,632
Purchase Details
Closed on
Aug 1, 2002
Sold by
Toplikar Michael A and Toplikar Margaret A
Bought by
Ohara Patrick B and Ohara Carole A
Home Financials for this Owner
Home Financials are based on the most recent Mortgage that was taken out on this home.
Original Mortgage
$105,950
Interest Rate
6.53%
Create a Home Valuation Report for This Property
The Home Valuation Report is an in-depth analysis detailing your home's value as well as a comparison with similar homes in the area
Home Values in the Area
Average Home Value in this Area
Purchase History
| Date | Buyer | Sale Price | Title Company |
|---|---|---|---|
| Richardson Blake Saner | -- | Security 1St Title Llc | |
| Davis Philip Edward | -- | Mid America Title Co Inc | |
| Ohara Patrick B | -- | Midwest Title Company Inc |
Source: Public Records
Mortgage History
| Date | Status | Borrower | Loan Amount |
|---|---|---|---|
| Open | Davis Philip Edward | $143,991 | |
| Previous Owner | Ohara Patrick B | $105,950 |
Source: Public Records
Tax History Compared to Growth
Tax History
| Year | Tax Paid | Tax Assessment Tax Assessment Total Assessment is a certain percentage of the fair market value that is determined by local assessors to be the total taxable value of land and additions on the property. | Land | Improvement |
|---|---|---|---|---|
| 2024 | $3,886 | $31,935 | $6,725 | $25,210 |
| 2023 | $3,820 | $30,440 | $6,725 | $23,715 |
| 2022 | $3,642 | $28,693 | $5,604 | $23,089 |
| 2021 | $3,284 | $24,794 | $5,336 | $19,458 |
| 2020 | $3,061 | $22,586 | $4,846 | $17,740 |
| 2019 | $2,770 | $20,770 | $4,037 | $16,733 |
| 2018 | $2,654 | $19,504 | $4,034 | $15,470 |
| 2017 | $2,719 | $20,136 | $3,666 | $16,470 |
| 2016 | $2,487 | $18,308 | $3,666 | $14,642 |
| 2015 | $2,395 | $17,733 | $3,666 | $14,067 |
| 2013 | -- | $16,686 | $3,666 | $13,020 |
Source: Public Records
Map
Nearby Homes
- 17330 S Walter St
- 31330 W Barbara Ct
- 17310 S Ingrid St
- 31652 W 174th St
- 31130 W 172nd Terrace
- 17411 S Ingrid St
- 31471 W Madison St
- 31699 W 170th Terrace
- 16300 Waverly Rd
- 31715 W 170th Terrace
- 31723 W 170th Terrace
- 31904 W 175th St
- 15424 Gardner Rd E
- 31956 W 172nd St
- 0 Pratt St
- 736 W Shawnee Ct
- 31901 W 170th Terrace
- 31917 W 170th Terrace
- RC Roselyn Plan at Cypress Creek
- RC Franklin Plan at Cypress Creek
- 31350 W 173rd Terrace
- 31330 W 173rd Terrace
- 31341 Barbara Ct
- 31331 Barbara Ct
- 17341 S Walter St
- 17331 S Walter St
- 17351 S Walter St
- 31320 W 173rd Terrace
- 17321 S Walter St
- 31321 Barbara Ct
- 17361 S Walter St
- 31341 W 173rd Terrace
- 31340 Barbara Ct
- 17311 S Walter St
- 31331 W 173rd Terrace
- 31310 W 173rd Terrace
- 31321 W 173rd Terrace
- 31311 Barbara Ct
- 17371 S Walter St
- 17301 S Walter St