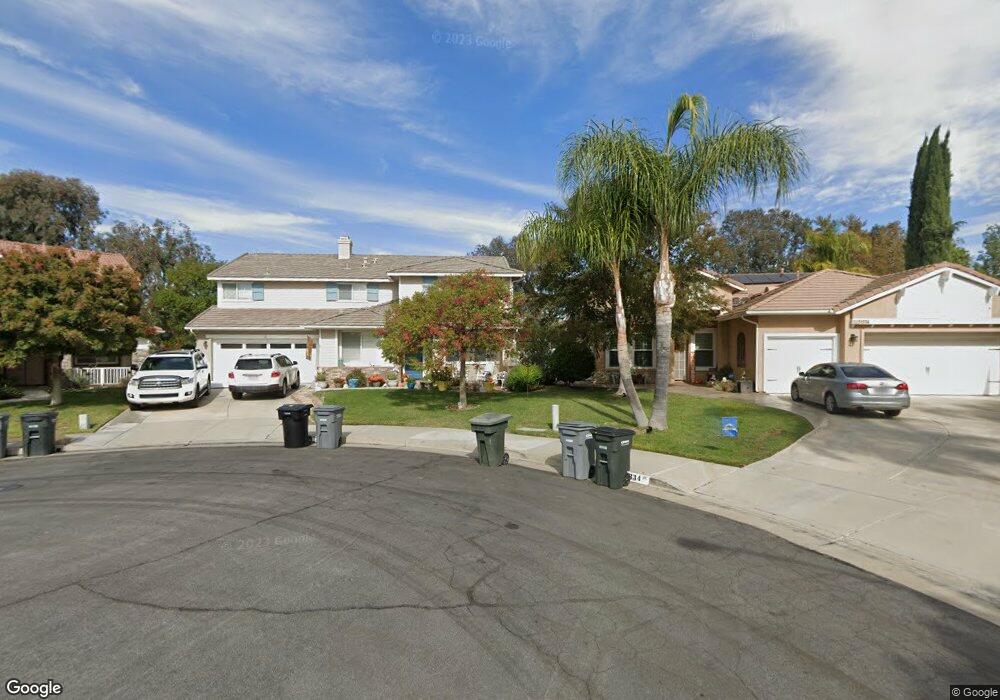
31343 Britton Cir Temecula, CA 92591
Chardonnay Hills NeighborhoodEstimated Value: $759,329 - $853,000
5
Beds
3
Baths
2,867
Sq Ft
$284/Sq Ft
Est. Value
About This Home
This home is located at 31343 Britton Cir, Temecula, CA 92591 and is currently estimated at $813,582, approximately $283 per square foot. 31343 Britton Cir is a home located in Riverside County with nearby schools including Rancho Elementary School, Margarita Middle School, and Temecula Valley High School.
Ownership History
Date
Name
Owned For
Owner Type
Purchase Details
Closed on
Aug 30, 2011
Sold by
Putman William R and Putman Mary Jane
Bought by
Putman William R and Putman Mary Jane
Current Estimated Value
Purchase Details
Closed on
Dec 22, 2010
Sold by
Putman William R and Putman Mary Jane
Bought by
Putman William R and Putman Mary Jane
Home Financials for this Owner
Home Financials are based on the most recent Mortgage that was taken out on this home.
Original Mortgage
$149,000
Outstanding Balance
$99,091
Interest Rate
4.35%
Mortgage Type
New Conventional
Estimated Equity
$714,491
Purchase Details
Closed on
Jul 18, 1997
Sold by
Bramalea California Inc
Bought by
Putman William R and Putman Mary Jane
Home Financials for this Owner
Home Financials are based on the most recent Mortgage that was taken out on this home.
Original Mortgage
$197,425
Interest Rate
7.54%
Mortgage Type
VA
Create a Home Valuation Report for This Property
The Home Valuation Report is an in-depth analysis detailing your home's value as well as a comparison with similar homes in the area
Home Values in the Area
Average Home Value in this Area
Purchase History
| Date | Buyer | Sale Price | Title Company |
|---|---|---|---|
| Putman William R | -- | None Available | |
| Putman William R | -- | Chicago Title | |
| Putman William R | $193,000 | First American Title Ins Co |
Source: Public Records
Mortgage History
| Date | Status | Borrower | Loan Amount |
|---|---|---|---|
| Open | Putman William R | $149,000 | |
| Previous Owner | Putman William R | $197,425 |
Source: Public Records
Tax History
| Year | Tax Paid | Tax Assessment Tax Assessment Total Assessment is a certain percentage of the fair market value that is determined by local assessors to be the total taxable value of land and additions on the property. | Land | Improvement |
|---|---|---|---|---|
| 2025 | $3,891 | $326,650 | $62,295 | $264,355 |
| 2023 | $3,891 | $313,968 | $59,877 | $254,091 |
| 2022 | $3,764 | $307,812 | $58,703 | $249,109 |
| 2021 | $3,680 | $301,777 | $57,552 | $244,225 |
| 2020 | $3,638 | $298,683 | $56,962 | $241,721 |
| 2019 | $3,582 | $292,828 | $55,846 | $236,982 |
| 2018 | $3,507 | $287,087 | $54,752 | $232,335 |
| 2017 | $3,442 | $281,459 | $53,679 | $227,780 |
| 2016 | $3,375 | $275,941 | $52,627 | $223,314 |
| 2015 | $3,313 | $271,798 | $51,838 | $219,960 |
| 2014 | $3,209 | $266,476 | $50,824 | $215,652 |
Source: Public Records
Map
Nearby Homes
- 31492 Britton Cir
- 39502 S Fiesta Ranch Rd
- 39508 S Fiesta Ranch Rd
- 39514 S Fiesta Ranch Rd
- 32040 S Fiesta Ranch Rd
- 32130 Fiesta Ranch Rd S
- 32047 S Fiesta Ranch Rd
- 0 Winchester Rd Unit IG26012987
- 0 Vista Del Monte Rd Unit SW24075540
- 31939 Calle Elenita
- 31345 Avenida Del Reposo
- 40601 Cebu St
- 31425 Culbertson Ln
- 40579 New Town Dr
- 40973 Cebu Dr
- 41087 Promenade Chardonnay Hills
- 31461 Congressional Dr
- 40493 Calle Katerine
- 31173 Avenida Del Reposo
- 31235 Calle Felicidad
- 31351 Britton Cir
- 31359 Britton Cir
- 41019 Simi Ct
- 41027 Simi Ct
- 41011 Simi Ct
- 31367 Britton Cir
- 31400 Britton Cir
- 31416 Britton Cir
- 31415 Cabern Ct
- 31375 Britton Cir
- 31423 Cabern Ct
- 41003 Simi Ct
- 31405 Cabern Ct
- 31383 Britton Cir
- 31422 Cabern Ct
- 41006 Simi Ct
- 31391 Britton Cir
- 41030 Simi Ct
- 31399 Britton Cir
Your Personal Tour Guide
Ask me questions while you tour the home.