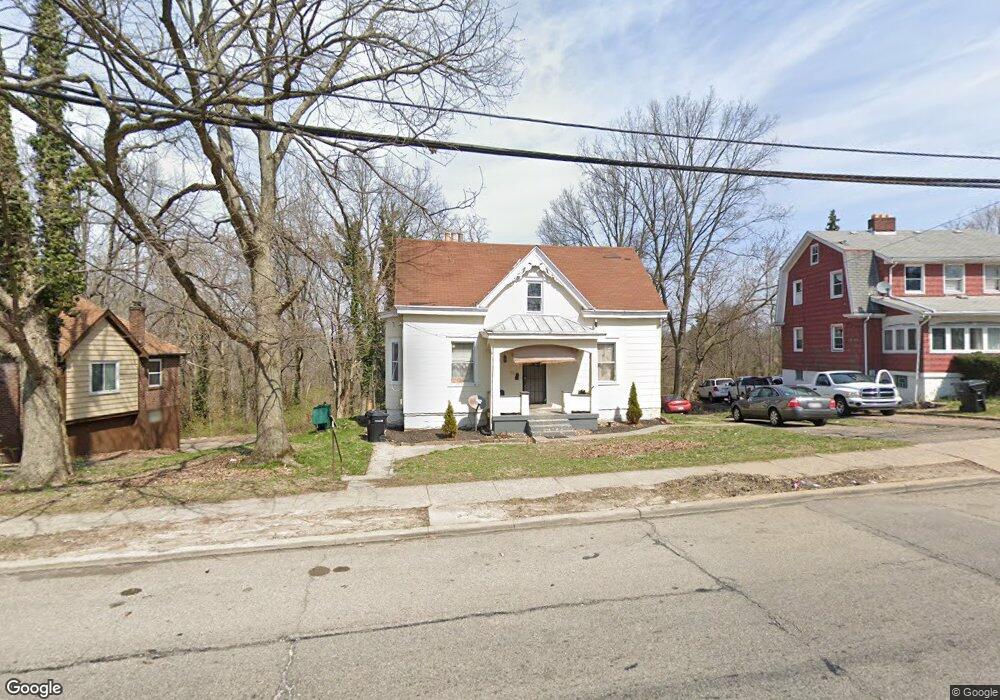
3135 Mchenry Ave Cincinnati, OH 45211
Westwood NeighborhoodEstimated Value: $114,000 - $158,662
4
Beds
2
Baths
1,598
Sq Ft
$84/Sq Ft
Est. Value
About This Home
This home is located at 3135 Mchenry Ave, Cincinnati, OH 45211 and is currently estimated at $134,666, approximately $84 per square foot. 3135 Mchenry Ave is a home located in Hamilton County with nearby schools including Western Hills High School, Gilbert A. Dater High School, and Robert A. Taft Information Technology High School.
Ownership History
Date
Name
Owned For
Owner Type
Purchase Details
Closed on
Feb 19, 2008
Sold by
Deutsche Bank National Trust Co
Bought by
Nassau Investments Llc
Current Estimated Value
Purchase Details
Closed on
Jul 25, 2007
Sold by
Johnson Valicia D and Johnson Warner
Bought by
Deutsche Bank National Trust Co and Long Beach Mortgage Loan Trust 2006-Wl2
Purchase Details
Closed on
Jan 4, 2004
Sold by
Johnson Valicia D and Johnson Warner
Bought by
Johnson Warner and Johnson Valicia D
Purchase Details
Closed on
Sep 30, 2003
Sold by
First Union National Bank Of Delaware
Bought by
Johnson Valicia D
Purchase Details
Closed on
Sep 4, 2002
Sold by
Lee Walter O
Bought by
First Union National Bank Of Delaware
Purchase Details
Closed on
Oct 19, 1999
Sold by
Dewyan Thomas Stanley and Dewyan Darlene
Bought by
Lee Walter O
Home Financials for this Owner
Home Financials are based on the most recent Mortgage that was taken out on this home.
Original Mortgage
$67,500
Interest Rate
7.87%
Create a Home Valuation Report for This Property
The Home Valuation Report is an in-depth analysis detailing your home's value as well as a comparison with similar homes in the area
Home Values in the Area
Average Home Value in this Area
Purchase History
| Date | Buyer | Sale Price | Title Company |
|---|---|---|---|
| Nassau Investments Llc | $13,000 | Sovereign Title Agency Llc | |
| Deutsche Bank National Trust Co | $97,167 | None Available | |
| Johnson Warner | -- | -- | |
| Johnson Valicia D | $35,000 | -- | |
| First Union National Bank Of Delaware | $30,000 | -- | |
| Lee Walter O | $75,000 | -- |
Source: Public Records
Mortgage History
| Date | Status | Borrower | Loan Amount |
|---|---|---|---|
| Previous Owner | Lee Walter O | $67,500 |
Source: Public Records
Tax History
| Year | Tax Paid | Tax Assessment Tax Assessment Total Assessment is a certain percentage of the fair market value that is determined by local assessors to be the total taxable value of land and additions on the property. | Land | Improvement |
|---|---|---|---|---|
| 2025 | $1,681 | $26,152 | $7,140 | $19,012 |
| 2023 | $1,681 | $26,152 | $7,140 | $19,012 |
| 2022 | $1,008 | $13,962 | $6,237 | $7,725 |
| 2021 | $984 | $13,962 | $6,237 | $7,725 |
| 2020 | $986 | $13,962 | $6,237 | $7,725 |
| 2019 | $985 | $12,691 | $5,670 | $7,021 |
| 2018 | $985 | $12,691 | $5,670 | $7,021 |
| 2017 | $948 | $12,691 | $5,670 | $7,021 |
| 2016 | $543 | $7,000 | $5,929 | $1,071 |
| 2015 | $487 | $7,000 | $5,929 | $1,071 |
| 2014 | $489 | $7,000 | $5,929 | $1,071 |
| 2013 | $1,234 | $17,697 | $7,858 | $9,839 |
Source: Public Records
Map
Nearby Homes
- 3162 Sunshine Ave
- 3041 Westknolls Ln
- 2424 Westwood Northern Blvd
- 3116 Gobel Ave
- 3312 Mchenry Ave
- 3328 Brodbeck Place
- 2962 Aquadale Ln
- 3295 Fyffe Ave
- 3069 Bracken Woods Ln
- 3073 Bracken Woods Ln
- 2668 Shaffer Ave
- 2525 Millennium Place
- 2942 Woodrow Ave
- 3404 Millrich Ave
- 2635 Ocosta Ave
- 3384 Ninann Ct
- 2257 Harrison Ave
- 2655 Harrison Ave
- 2183 Westwood Northern Blvd
- 3427 Bighorn Ct
- 3131 Mchenry Ave
- 3139 Mchenry Ave
- 3123 Mchenry Ave
- 3141 Mchenry Ave
- 3151 Mchenry Ave
- 3121 Mchenry Ave
- 3148 Mchenry Ave
- 3153 Mchenry Ave
- 3117 Mchenry Ave
- 3150 Mchenry Ave
- 3155 Mchenry Ave
- 3122 Sunshine Ave
- 3113 Mchenry Ave
- 3116 Mchenry Ave
- 3157 Mchenry Ave
- 3111 Wooster Place
- 3115 Wooster Place
- 3119 Wooster Place
- 3115 Wooster Place
- 3111 Mchenry Ave
Your Personal Tour Guide
Ask me questions while you tour the home.