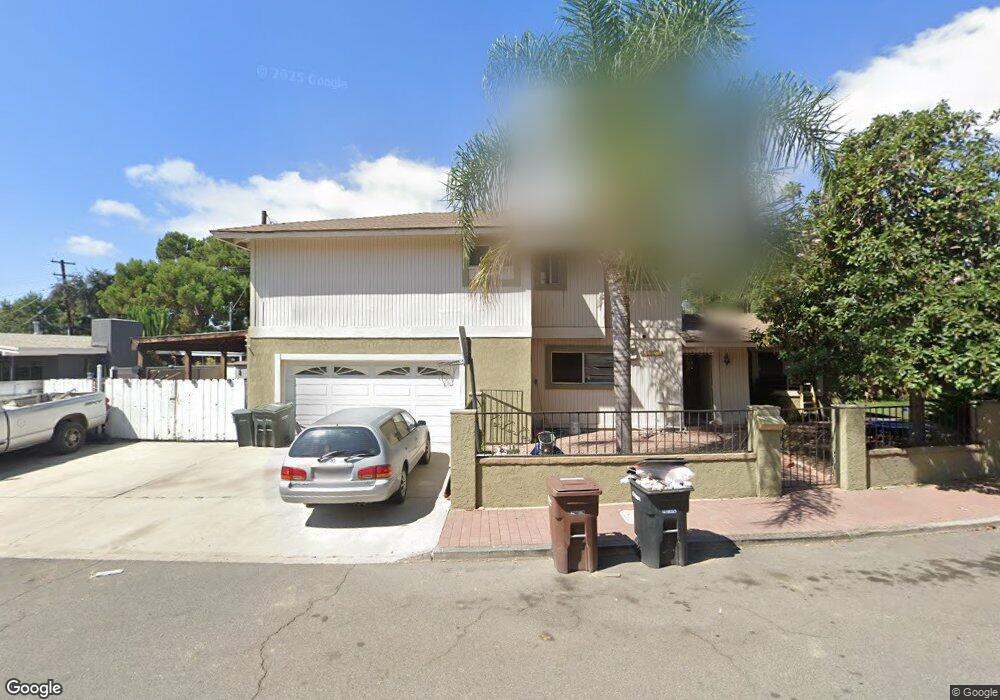
31351 La Calera St San Juan Capistrano, CA 92675
Estimated Value: $969,484 - $1,197,000
3
Beds
3
Baths
1,450
Sq Ft
$734/Sq Ft
Est. Value
About This Home
This home is located at 31351 La Calera St, San Juan Capistrano, CA 92675 and is currently estimated at $1,064,621, approximately $734 per square foot. 31351 La Calera St is a home located in Orange County with nearby schools including San Juan Elementary School, Marco Forster Middle School, and San Juan Hills High School.
Ownership History
Date
Name
Owned For
Owner Type
Purchase Details
Closed on
Jan 28, 2017
Sold by
Sandoval Raul and Sandoval Salvador
Bought by
Sandoval Raul
Current Estimated Value
Home Financials for this Owner
Home Financials are based on the most recent Mortgage that was taken out on this home.
Original Mortgage
$388,700
Interest Rate
3.93%
Mortgage Type
New Conventional
Purchase Details
Closed on
Dec 1, 2016
Sold by
Sandoval Raul
Bought by
Sandoval Raul and Sandoval Salvador
Home Financials for this Owner
Home Financials are based on the most recent Mortgage that was taken out on this home.
Original Mortgage
$388,700
Interest Rate
3.93%
Mortgage Type
New Conventional
Purchase Details
Closed on
Sep 20, 2002
Sold by
Desandoval Esperanza Vega
Bought by
Sandoval Salvador and Sandoval Vicente
Home Financials for this Owner
Home Financials are based on the most recent Mortgage that was taken out on this home.
Original Mortgage
$159,000
Interest Rate
6.05%
Create a Home Valuation Report for This Property
The Home Valuation Report is an in-depth analysis detailing your home's value as well as a comparison with similar homes in the area
Home Values in the Area
Average Home Value in this Area
Purchase History
| Date | Buyer | Sale Price | Title Company |
|---|---|---|---|
| Sandoval Raul | -- | First American Title Co | |
| Sandoval Raul | -- | Accommodation | |
| Sandoval Salvador | -- | Fidelity National Title Co | |
| Sandoval Raul | -- | Fidelity National Title Co |
Source: Public Records
Mortgage History
| Date | Status | Borrower | Loan Amount |
|---|---|---|---|
| Previous Owner | Sandoval Raul | $388,700 | |
| Previous Owner | Sandoval Raul | $159,000 |
Source: Public Records
Tax History Compared to Growth
Tax History
| Year | Tax Paid | Tax Assessment Tax Assessment Total Assessment is a certain percentage of the fair market value that is determined by local assessors to be the total taxable value of land and additions on the property. | Land | Improvement |
|---|---|---|---|---|
| 2025 | $3,510 | $311,870 | $176,357 | $135,513 |
| 2024 | $3,510 | $305,755 | $172,899 | $132,856 |
| 2023 | $3,379 | $299,760 | $169,509 | $130,251 |
| 2022 | $3,046 | $293,883 | $166,185 | $127,698 |
| 2021 | $2,990 | $288,121 | $162,926 | $125,195 |
| 2020 | $2,964 | $285,167 | $161,255 | $123,912 |
| 2019 | $2,909 | $279,576 | $158,093 | $121,483 |
| 2018 | $2,857 | $274,095 | $154,994 | $119,101 |
| 2017 | $2,831 | $268,721 | $151,955 | $116,766 |
| 2016 | $2,779 | $263,452 | $148,975 | $114,477 |
| 2015 | $2,736 | $259,495 | $146,737 | $112,758 |
| 2014 | $2,688 | $254,412 | $143,862 | $110,550 |
Source: Public Records
Map
Nearby Homes
- 31261 Paseo Olivos
- 27381 Via Priorato
- 31608 Los Rios St Unit 147
- 31377 Los Rios St Unit 64
- 31284 Calle San Juan Unit 14
- 31278 Calle San Juan Unit 12
- 31121 Via Santo Tomas
- 30981 Via Mirador
- 26468 Calle San Antonio
- 26447 Paseo Carmel Unit 11D
- 31024 Calle San Diego Unit 94b
- 0 Aguacate Rd Unit 25558127
- 90 Plaza de Las Flores
- 31980 Via Refrescar
- 30828 Calle Chueca
- 27594 Starrise Ln
- 32024 Paseo Rama
- 31527 Aguacate Rd
- 27681 Paseo Esteban
- 32011 Via Tonada Unit 9
- 31344 El Horno St
- 31361 La Calera St Unit FRONT
- 31361 La Calera St
- 31371 La Calera St
- 31331 El Horno St
- 31322 Don Juan Ave
- 31381 La Calera St
- 31326 Don Juan Ave
- 31345 El Horno St
- 31382 La Calera St
- 31306 Don Juan Ave
- 31391 La Calera St
- 31382 La Matanza St
- 31351 El Horno St
- 31302 Don Juan Ave
- 31355 El Horno St
- 31401 La Calera St
- 31392 La Matanza St Unit 2
- 31392 La Matanza St
- 31392 La Matanza St