Estimated Value: $468,000 - $552,575
4
Beds
3
Baths
1,604
Sq Ft
$309/Sq Ft
Est. Value
About This Home
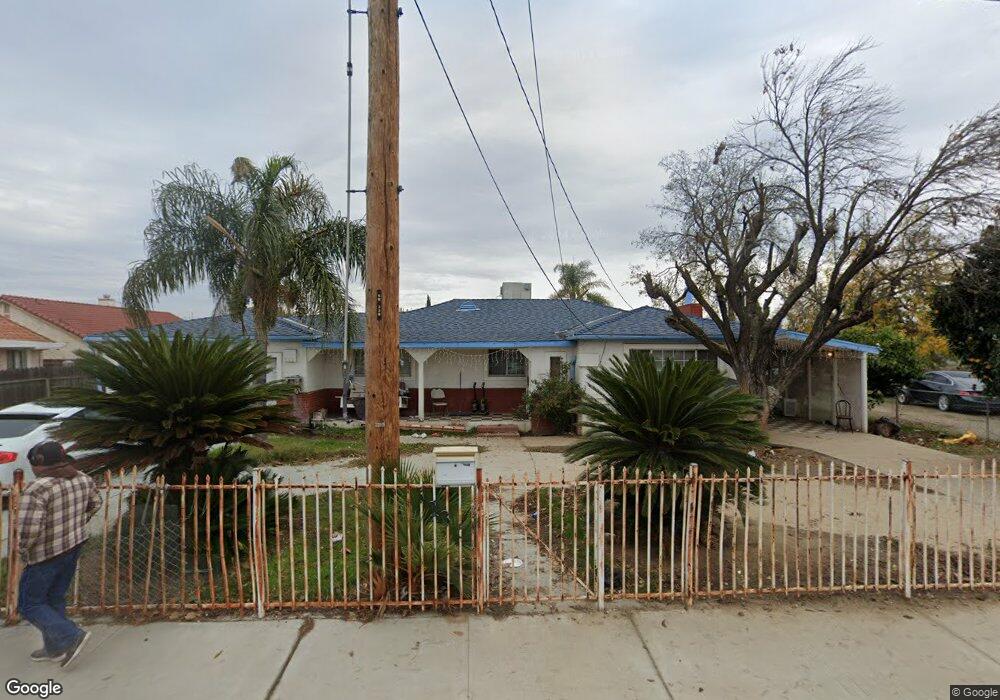
This home is located at 3136 Blaker Rd, Ceres, CA 95307 and is currently estimated at $496,144, approximately $309 per square foot. 3136 Blaker Rd is a home located in Stanislaus County with nearby schools including Don Pedro Elementary School, Blaker-Kinser Junior High School, and Central Valley High School.
Ownership History
Date
Name
Owned For
Owner Type
Purchase Details
Closed on
Oct 16, 2025
Sold by
Rochel Bernardo
Bought by
Turlock Irrigation District
Current Estimated Value
Purchase Details
Closed on
Sep 21, 2023
Sold by
Rochel Bernardo
Bought by
Turlock Irrigation District
Purchase Details
Closed on
Sep 16, 2022
Sold by
Bernardo Rochel
Bought by
Turlock Irrigation District
Purchase Details
Closed on
Jul 18, 2002
Sold by
Rochel Ignacio
Bought by
The City Of Ceres
Purchase Details
Closed on
Sep 11, 1997
Sold by
Home Svgs Of America Fsb
Bought by
Rochel Beatriz
Purchase Details
Closed on
Jan 10, 1996
Sold by
Farrar Gary
Bought by
Rochel Ignacio and Rochel Beatriz
Purchase Details
Closed on
Jan 4, 1995
Sold by
Waas Georgia and Green Jerry A
Bought by
Rochel Ignacio and Rochel Beatriz
Purchase Details
Closed on
Oct 20, 1994
Sold by
Gunter Bessie G
Bought by
Rochel Ignacio and Rochel Beatriz
Create a Home Valuation Report for This Property
The Home Valuation Report is an in-depth analysis detailing your home's value as well as a comparison with similar homes in the area
Purchase History
| Date | Buyer | Sale Price | Title Company |
|---|---|---|---|
| Turlock Irrigation District | -- | -- | |
| Turlock Irrigation District | -- | -- | |
| Turlock Irrigation District | -- | -- | |
| The City Of Ceres | -- | -- | |
| Rochel Beatriz | $34,000 | Stewart Title | |
| Rochel Ignacio | $50,000 | Chicago Title Co | |
| Rochel Ignacio | $41,000 | North American Title Ins Co | |
| Rochel Ignacio | $35,000 | North American Title Ins Co |
Source: Public Records
Tax History
| Year | Tax Paid | Tax Assessment Tax Assessment Total Assessment is a certain percentage of the fair market value that is determined by local assessors to be the total taxable value of land and additions on the property. | Land | Improvement |
|---|---|---|---|---|
| 2025 | $4,767 | $414,322 | $195,323 | $218,999 |
| 2024 | $4,467 | $406,199 | $191,494 | $214,705 |
| 2023 | $4,344 | $398,236 | $187,740 | $210,496 |
| 2022 | $4,307 | $390,428 | $184,059 | $206,369 |
| 2021 | $4,266 | $382,773 | $180,450 | $202,323 |
| 2020 | $4,133 | $378,849 | $178,600 | $200,249 |
| 2019 | $4,105 | $371,422 | $175,099 | $196,323 |
| 2018 | $4,035 | $364,140 | $171,666 | $192,474 |
| 2017 | $3,952 | $354,000 | $183,000 | $171,000 |
| 2016 | $3,586 | $322,000 | $140,000 | $182,000 |
| 2015 | $2,938 | $264,500 | $82,500 | $182,000 |
| 2014 | $2,663 | $240,500 | $75,000 | $165,500 |
Source: Public Records
Map
Nearby Homes
- 3116 Larrynell Dr
- 1628 Sungate Dr
- 3816 Dano Ct
- 3816 Teek Ct
- 1440 Don Pedro Rd
- 3608 Cassie Ln
- 3449 Guru Dr
- 3939 Central Ave Unit 126
- 3939 Central Ave Unit 35
- 3939 Central Ave Unit 178
- 2800 Skybrite Dr
- 2921 5th St
- 954 Avenida Real
- 940 Allacante Dr
- 815 Starke Dr
- 1734 Norwood Heights Ln
- 2617 E Whitmore Ave
- 3632 9th St
- 1713 Pikake Ct
- 1833 Richard Way
- 1712 Doyle Ave
- 1716 Doyle Ave
- 1720 Doyle Ave
- 1623 Cancimilla Ct
- 1724 Doyle Ave
- 3207 Blaker Rd
- 1624 Flower Garden Ct
- 1619 Cancimilla Ct
- 1728 Doyle Ave
- 1705 Doyle Ave
- 1709 Doyle Ave
- 1620 Cancimilla Ct
- 1620 Flower Garden Ct
- 1713 Doyle Ave
- 1709 Hackett Rd
- 1615 Cancimilla Ct
- 3205 Blaker Rd
- 1732 Doyle Ave
- 1723 Melba Ct
- 1623 Flower Garden Ct
Your Personal Tour Guide
Ask me questions while you tour the home.