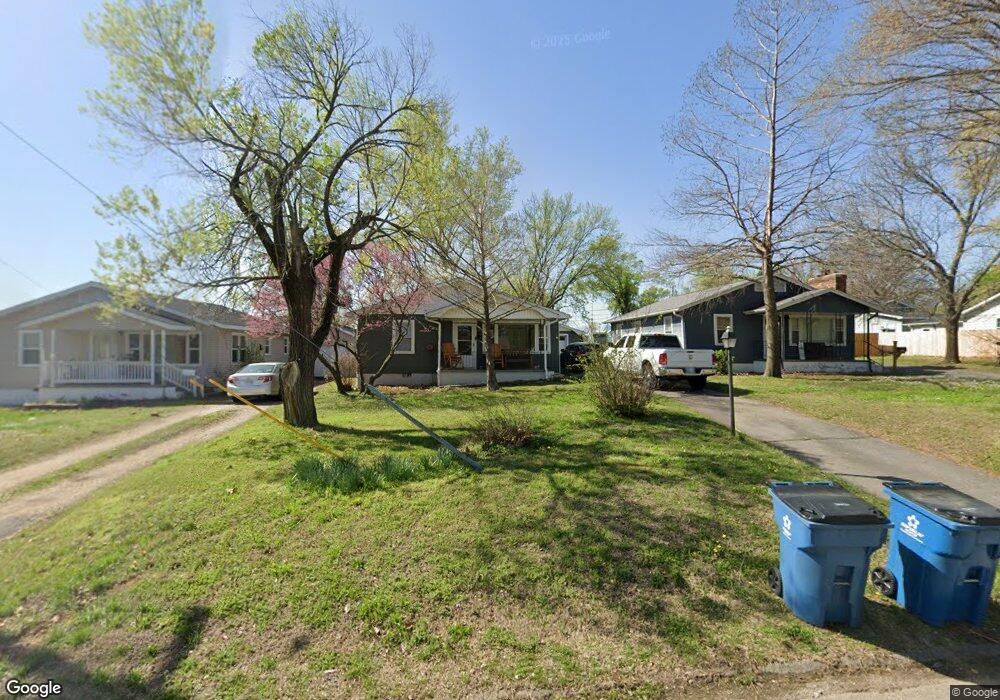
3136 E 10th St Joplin, MO 64801
Hatten NeighborhoodEstimated Value: $131,000 - $144,000
3
Beds
1
Bath
1,080
Sq Ft
$128/Sq Ft
Est. Value
About This Home
This home is located at 3136 E 10th St, Joplin, MO 64801 and is currently estimated at $137,716, approximately $127 per square foot. 3136 E 10th St is a home located in Jasper County with nearby schools including Soaring Heights Elementary School, East Middle School, and Joplin High School.
Ownership History
Date
Name
Owned For
Owner Type
Purchase Details
Closed on
Feb 2, 2024
Sold by
Sexton Jennifer
Bought by
Sexton Waylon C
Current Estimated Value
Purchase Details
Closed on
Nov 4, 2022
Sold by
Postle Julie and Postle Greg
Bought by
Sexton Cody and Sexton Jennifer
Home Financials for this Owner
Home Financials are based on the most recent Mortgage that was taken out on this home.
Original Mortgage
$86,000
Interest Rate
6.7%
Mortgage Type
New Conventional
Purchase Details
Closed on
Dec 17, 2021
Sold by
Mary A Schriever Living Trust
Bought by
Postle Julie
Purchase Details
Closed on
Jan 13, 2014
Sold by
Schriever Mary A
Bought by
Schriever Ii Roland L and Mary A Schriever Living Trust
Purchase Details
Closed on
Dec 12, 2005
Sold by
Sexton David F
Bought by
Schriever Mary A
Home Financials for this Owner
Home Financials are based on the most recent Mortgage that was taken out on this home.
Original Mortgage
$55,900
Interest Rate
6.29%
Mortgage Type
Fannie Mae Freddie Mac
Create a Home Valuation Report for This Property
The Home Valuation Report is an in-depth analysis detailing your home's value as well as a comparison with similar homes in the area
Home Values in the Area
Average Home Value in this Area
Purchase History
| Date | Buyer | Sale Price | Title Company |
|---|---|---|---|
| Sexton Waylon C | -- | None Listed On Document | |
| Sexton Cody | -- | -- | |
| Postle Julie | -- | None Listed On Document | |
| Schriever Ii Roland L | -- | None Available | |
| Schriever Mary A | -- | Fatco |
Source: Public Records
Mortgage History
| Date | Status | Borrower | Loan Amount |
|---|---|---|---|
| Previous Owner | Sexton Cody | $86,000 | |
| Previous Owner | Schriever Mary A | $55,900 |
Source: Public Records
Tax History
| Year | Tax Paid | Tax Assessment Tax Assessment Total Assessment is a certain percentage of the fair market value that is determined by local assessors to be the total taxable value of land and additions on the property. | Land | Improvement |
|---|---|---|---|---|
| 2025 | $491 | $12,000 | $1,190 | $10,810 |
| 2024 | $491 | $10,630 | $1,190 | $9,440 |
| 2023 | $491 | $10,630 | $1,190 | $9,440 |
| 2022 | $469 | $10,190 | $1,190 | $9,000 |
| 2021 | $466 | $10,190 | $1,190 | $9,000 |
| 2020 | $438 | $9,380 | $1,190 | $8,190 |
| 2019 | $439 | $9,380 | $1,190 | $8,190 |
| 2018 | $437 | $9,380 | $0 | $0 |
| 2017 | $439 | $9,380 | $0 | $0 |
| 2016 | $433 | $9,380 | $0 | $0 |
Source: Public Records
Map
Nearby Homes
- 3123 E 10th St
- 3120 E 11th St
- 3037 E 10th St
- 2916 E 9th St
- 1407 Rex Ave
- 1413 Rex Ave
- Tract 3 Jericho Ln
- Tract 6 Jericho Ln
- 1026 Texas Cir
- 1001 Katherine Ave
- 2841 E 14th St
- 3529 E 7th St
- 2808 E 7th St
- 3601 E 7th St
- 2650 E 8th St
- 831 S Ozark Ave
- 3737 E 7th St
- 901 Walnut Ridge St
- 1028 Woodland Ave
- 3507 E 20th St Unit 2
- 3140 E 10th St
- 3132 E 10th St
- 3144 E 10th St
- 3124 E 10th St
- 3135 E 11th St
- 3139 E 11th St
- 3129 E 11th St
- 3143 E 10th St Unit 3147
- 3114 E 10th St
- 3125 E 11th St
- 3147 E 11th St
- 3131 E 10th St
- 3129 E 10th St
- 3125 E 10th St
- 3121 E 11th St
- 3110 E 10th St
- 3117 E 10th St
- 3109 E 11th St
- 3106 E 10th St
- 3109 E 10th St