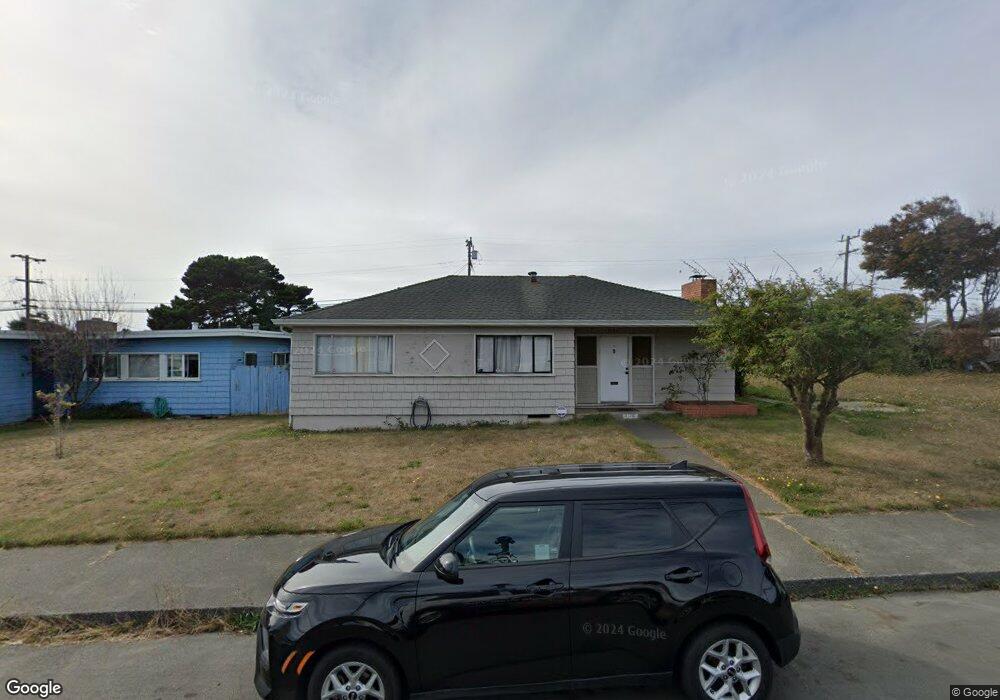
3136 Oregon St Eureka, CA 95503
Rosewood NeighborhoodEstimated Value: $264,000 - $345,000
3
Beds
1
Bath
1,024
Sq Ft
$307/Sq Ft
Est. Value
About This Home
This home is located at 3136 Oregon St, Eureka, CA 95503 and is currently estimated at $314,784, approximately $307 per square foot. 3136 Oregon St is a home located in Humboldt County with nearby schools including Alice Birney Elementary School, Winship Middle School, and Eureka Senior High School.
Ownership History
Date
Name
Owned For
Owner Type
Purchase Details
Closed on
May 5, 2020
Sold by
Olsen Rebecca L
Bought by
Rodriguez Jeremy
Current Estimated Value
Home Financials for this Owner
Home Financials are based on the most recent Mortgage that was taken out on this home.
Original Mortgage
$120,000
Outstanding Balance
$106,478
Interest Rate
3.6%
Mortgage Type
New Conventional
Estimated Equity
$208,306
Create a Home Valuation Report for This Property
The Home Valuation Report is an in-depth analysis detailing your home's value as well as a comparison with similar homes in the area
Home Values in the Area
Average Home Value in this Area
Purchase History
| Date | Buyer | Sale Price | Title Company |
|---|---|---|---|
| Rodriguez Jeremy | $170,000 | Humboldt Land Title | |
| Olsen Rebecca L | -- | -- |
Source: Public Records
Mortgage History
| Date | Status | Borrower | Loan Amount |
|---|---|---|---|
| Open | Rodriguez Jeremy | $120,000 |
Source: Public Records
Tax History
| Year | Tax Paid | Tax Assessment Tax Assessment Total Assessment is a certain percentage of the fair market value that is determined by local assessors to be the total taxable value of land and additions on the property. | Land | Improvement |
|---|---|---|---|---|
| 2025 | $2,587 | $251,534 | $109,363 | $142,171 |
| 2024 | $2,587 | $246,603 | $107,219 | $139,384 |
| 2023 | $2,551 | $241,768 | $105,117 | $136,651 |
| 2022 | $2,648 | $237,028 | $103,056 | $133,972 |
| 2021 | $2,480 | $232,382 | $101,036 | $131,346 |
| 2020 | $556 | $51,947 | $10,919 | $41,028 |
| 2019 | $544 | $50,929 | $10,705 | $40,224 |
| 2018 | $536 | $49,932 | $10,496 | $39,436 |
| 2017 | $867 | $48,954 | $10,291 | $38,663 |
| 2016 | $826 | $47,995 | $10,090 | $37,905 |
| 2015 | $529 | $47,275 | $9,939 | $37,336 |
| 2014 | $495 | $46,350 | $9,745 | $36,605 |
Source: Public Records
Map
Nearby Homes
- 724 Stewart St
- 3512 Glen St
- 507 W Everding St
- 1304 McCullens Ave
- 2613 Spring St
- 318 W Harris St
- 1028 Allard Ave
- 3570 Albee St
- 3782 Little Fairfield St
- 2950 California St
- 3402 California St
- 2805 California St
- 2303 Union St
- 2249 Union St
- 2146 Albee St
- 3124 Ingley St
- 2738 A St
- 3316 Ingley St
- 2713 A St
- 516 W Hawthorne St
Your Personal Tour Guide
Ask me questions while you tour the home.