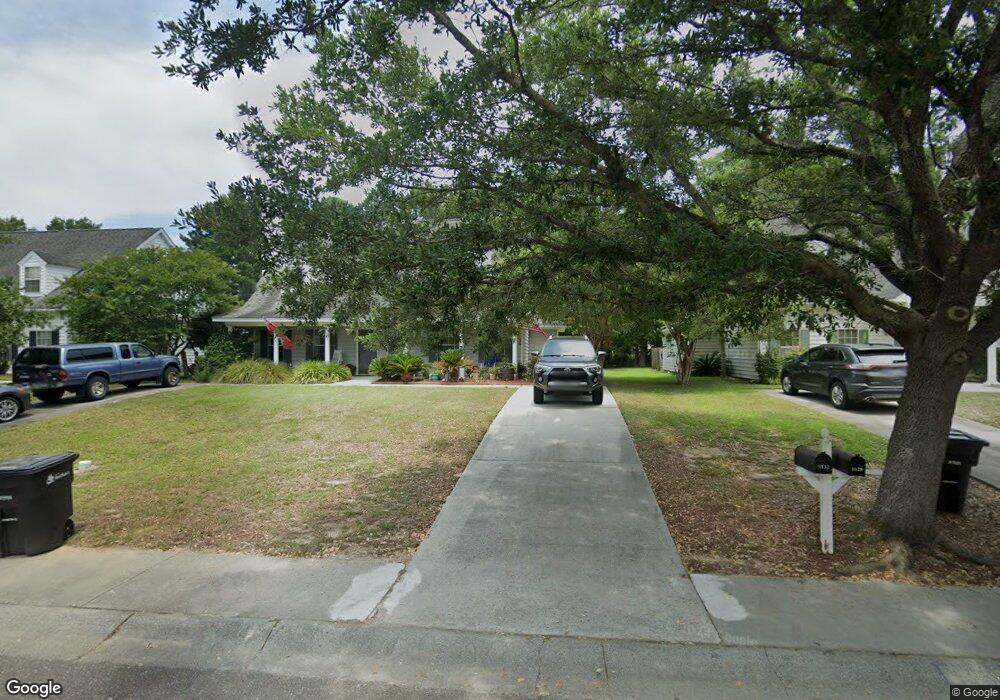
3136 Queensgate Way Mount Pleasant, SC 29466
Park West NeighborhoodEstimated Value: $386,000 - $417,000
3
Beds
2
Baths
1,397
Sq Ft
$291/Sq Ft
Est. Value
About This Home
This home is located at 3136 Queensgate Way, Mount Pleasant, SC 29466 and is currently estimated at $406,972, approximately $291 per square foot. 3136 Queensgate Way is a home located in Charleston County with nearby schools including Charles Pinckney Elementary School, Laurel Hill Primary School, and Thomas C. Cario Middle School.
Ownership History
Date
Name
Owned For
Owner Type
Purchase Details
Closed on
Oct 1, 2024
Sold by
Puig Norma G
Bought by
Puig Roberto B and Puig Roberto P
Current Estimated Value
Purchase Details
Closed on
Feb 16, 2012
Sold by
Schiavoni James A
Bought by
Puig Roberto B and Puig Norma
Purchase Details
Closed on
Apr 7, 2005
Sold by
Schiavoni Suzann J
Bought by
Schiavoni James A
Purchase Details
Closed on
Jul 11, 2003
Sold by
Laforte Anthony
Bought by
Schiavoni James A and Schiavoni Suzann J
Purchase Details
Closed on
Jun 5, 2003
Sold by
Schiavoni James A and Schiavoni Suzann J
Bought by
Laforte Anthony
Purchase Details
Closed on
Oct 10, 2001
Sold by
Laforte Anthony
Bought by
Schiavoni James A and Schiavoni Suzann J
Purchase Details
Closed on
Oct 8, 2001
Sold by
Schiavoni James A and Schiavoni Suzann J
Bought by
Laforte Anthony
Purchase Details
Closed on
Aug 22, 2000
Sold by
Laforte Anthony
Bought by
Schiavoni James A and Schiavoni Suzann J
Purchase Details
Closed on
Aug 2, 2000
Sold by
Winston Carlyle & Company Park West Llc
Bought by
Laforte Anthony
Create a Home Valuation Report for This Property
The Home Valuation Report is an in-depth analysis detailing your home's value as well as a comparison with similar homes in the area
Home Values in the Area
Average Home Value in this Area
Purchase History
| Date | Buyer | Sale Price | Title Company |
|---|---|---|---|
| Puig Roberto B | -- | None Listed On Document | |
| Puig Roberto B | $116,700 | -- | |
| Schiavoni James A | -- | -- | |
| Schiavoni James A | -- | -- | |
| Laforte Anthony | -- | -- | |
| Schiavoni James A | -- | -- | |
| Laforte Anthony | -- | -- | |
| Schiavoni James A | -- | -- | |
| Laforte Anthony | $116,335 | -- |
Source: Public Records
Tax History Compared to Growth
Tax History
| Year | Tax Paid | Tax Assessment Tax Assessment Total Assessment is a certain percentage of the fair market value that is determined by local assessors to be the total taxable value of land and additions on the property. | Land | Improvement |
|---|---|---|---|---|
| 2024 | $2,874 | $10,760 | $0 | $0 |
| 2023 | $2,874 | $10,760 | $0 | $0 |
| 2022 | $2,606 | $10,760 | $0 | $0 |
| 2021 | $2,604 | $10,760 | $0 | $0 |
| 2020 | $2,573 | $10,760 | $0 | $0 |
| 2019 | $2,345 | $9,350 | $0 | $0 |
| 2017 | $2,260 | $9,350 | $0 | $0 |
| 2016 | $2,183 | $9,350 | $0 | $0 |
| 2015 | $2,082 | $9,350 | $0 | $0 |
| 2014 | $2,092 | $0 | $0 | $0 |
| 2011 | -- | $0 | $0 | $0 |
Source: Public Records
Map
Nearby Homes
- 1676 Jorrington St
- 3336 Toomer Kiln Cir
- 2012 Hammond Dr
- 3498 Ashwycke St
- 1736 James Basford Place
- 3494 Ashwycke St
- 1572 Wellesley Cir
- 1664 William Hapton Way
- 1428 Bloomingdale Ln
- 1749 James Basford Place
- 1409 Bloomingdale Ln
- 1920 Hubbell Dr
- 3171 Sonja Way
- 2064 Promenade Ct
- 1629 Grey Marsh Rd
- 1624 Grey Marsh Rd
- 1579 Krait Ct
- 3261 Beaconsfield Rd
- 2666 Park Blvd W
- 2672 Park Blvd W
- 3132 Queensgate Way
- 3140 Queensgate Way
- 3128 Queensgate Way
- 3144 Queensgate Way
- 3124 Queensgate Way
- 3148 Queensgate Way
- 3466 Toomer Kiln Cir
- 3120 Queensgate Way
- 3462 Toomer Kiln Cir
- 3152 Queensgate Way
- 3470 Toomer Kiln Cir
- 3470 Toomer Kiln Cr
- 3116 Queensgate Way
- 3137 Queensgate Way
- 3458 Toomer Kiln Cir
- 3141 Queensgate Way
- 3133 Queensgate Way
- 3145 Queensgate Way
- 3156 Queensgate Way
- 3129 Queensgate Way