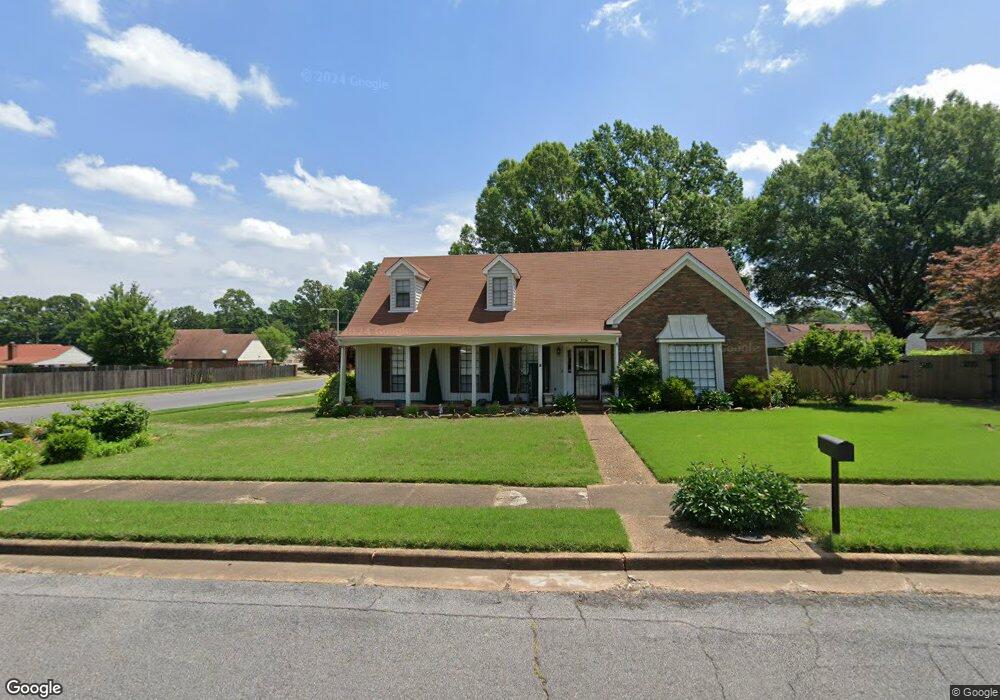
3136 Raleigh Ridge Cove Memphis, TN 38128
Raleigh NeighborhoodEstimated Value: $263,000 - $273,000
4
Beds
2
Baths
2,903
Sq Ft
$93/Sq Ft
Est. Value
About This Home
This home is located at 3136 Raleigh Ridge Cove, Memphis, TN 38128 and is currently estimated at $268,704, approximately $92 per square foot. 3136 Raleigh Ridge Cove is a home located in Shelby County with nearby schools including Brownsville Rd Elementary School, Craigmont Middle School, and Craigmont High School.
Ownership History
Date
Name
Owned For
Owner Type
Purchase Details
Closed on
Mar 7, 2025
Sold by
Beard Brinda Ann Williams and Williams Brinda Ann
Bought by
Williams Brinda Ann
Current Estimated Value
Home Financials for this Owner
Home Financials are based on the most recent Mortgage that was taken out on this home.
Original Mortgage
$201,465
Outstanding Balance
$199,319
Interest Rate
6.95%
Mortgage Type
FHA
Estimated Equity
$69,385
Purchase Details
Closed on
Feb 2, 2004
Sold by
Beard Renaye Cotrell
Bought by
Beard Brinda and Beard Williams
Purchase Details
Closed on
Aug 14, 2001
Sold by
Thurmond Ruth C
Bought by
Beard Brinda and Beard Renaye
Home Financials for this Owner
Home Financials are based on the most recent Mortgage that was taken out on this home.
Original Mortgage
$125,100
Interest Rate
10.75%
Purchase Details
Closed on
Mar 12, 2001
Sold by
Thurmond Ruth C
Bought by
Thurmond Ruth C and Ruth Thurmond Living Trust
Create a Home Valuation Report for This Property
The Home Valuation Report is an in-depth analysis detailing your home's value as well as a comparison with similar homes in the area
Home Values in the Area
Average Home Value in this Area
Purchase History
| Date | Buyer | Sale Price | Title Company |
|---|---|---|---|
| Williams Brinda Ann | -- | Js Title And Escrow Llc | |
| Beard Brinda | -- | -- | |
| Beard Brinda | $139,000 | -- | |
| Thurmond Ruth C | -- | -- |
Source: Public Records
Mortgage History
| Date | Status | Borrower | Loan Amount |
|---|---|---|---|
| Open | Williams Brinda Ann | $201,465 | |
| Previous Owner | Beard Brinda | $125,100 | |
| Closed | Beard Brinda | $6,950 |
Source: Public Records
Tax History Compared to Growth
Tax History
| Year | Tax Paid | Tax Assessment Tax Assessment Total Assessment is a certain percentage of the fair market value that is determined by local assessors to be the total taxable value of land and additions on the property. | Land | Improvement |
|---|---|---|---|---|
| 2025 | $1,386 | $65,575 | $6,250 | $59,325 |
| 2024 | $1,386 | $40,875 | $5,225 | $35,650 |
| 2023 | $2,490 | $40,875 | $5,225 | $35,650 |
| 2022 | $2,490 | $40,875 | $5,225 | $35,650 |
| 2021 | $2,519 | $40,875 | $5,225 | $35,650 |
| 2020 | $2,022 | $27,900 | $5,225 | $22,675 |
| 2019 | $2,022 | $27,900 | $5,225 | $22,675 |
| 2018 | $2,022 | $27,900 | $5,225 | $22,675 |
| 2017 | $1,147 | $27,900 | $5,225 | $22,675 |
| 2016 | $1,149 | $26,300 | $0 | $0 |
| 2014 | $1,149 | $26,300 | $0 | $0 |
Source: Public Records
Map
Nearby Homes
- 3213 Covington Pike
- 3261 Gatewood Dr
- 3064 Wood Thrush Dr
- 4850 Stage Rd
- 5167 Rolling Fields Dr
- 3294 Gatewood Dr
- 3209 Canyon Rd
- 5210 Wax Wing Ln
- 2888 Clearwood Rd
- 2892 Clearwood Rd
- 5209 Craigmont Dr
- 3099 Joslyn St
- 4851 Rolling Meadows Dr
- 3217 Joslyn St
- 3083 Kenneth St
- 5139 Steuben Dr
- 3331 Bluemont Dr
- 3219 Wythe Rd
- 5191 Yellowood Rd
- 3403 Lynchburg St
- 3126 Raleigh Ridge Cove
- 3135 Covington Pike
- 3135 Raleigh Ridge Cove
- 3125 Covington Pike
- 3154 Raleigh Ridge Dr
- 3116 Raleigh Ridge Cove
- 3121 Raleigh Ridge Cove
- 3153 Covington Pike
- 3115 Covington Pike
- 3155 Raleigh Ridge Dr
- 5013 Golightly Dr
- 3164 Raleigh Ridge Dr
- 3113 Raleigh Ridge Cove
- 3110 Raleigh Ridge Cove
- 3163 Covington Pike
- 3105 Covington Pike
- 5014 Golightly Dr
- 3165 Raleigh Ridge Dr
- 5006 Cobalt Cove
- 3109 Raleigh Ridge Cove