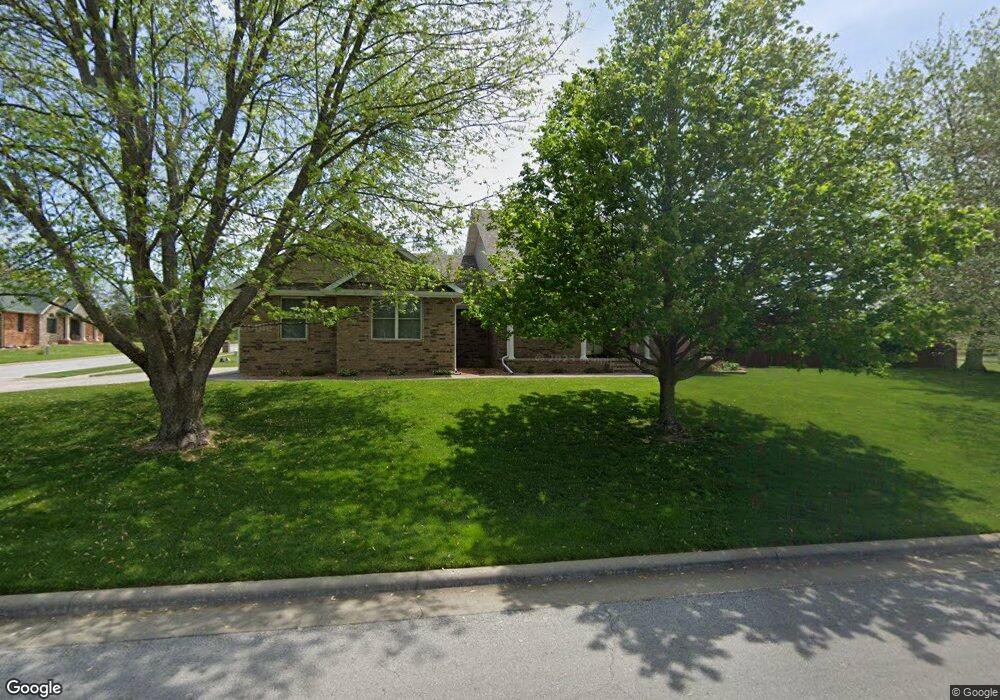
3136 W Grandview St Springfield, MO 65803
Estimated Value: $326,000 - $417,000
3
Beds
3
Baths
2,193
Sq Ft
$171/Sq Ft
Est. Value
About This Home
This home is located at 3136 W Grandview St, Springfield, MO 65803 and is currently estimated at $374,910, approximately $170 per square foot. 3136 W Grandview St is a home located in Greene County with nearby schools including Watkins Elementary School, Reed Academy, and Hillcrest High School.
Ownership History
Date
Name
Owned For
Owner Type
Purchase Details
Closed on
Oct 22, 2014
Sold by
Ed Holt Home Builders Llc
Bought by
The Maynard Leroy Lilley And Carol Ann L and Lilley Carol Ann
Current Estimated Value
Purchase Details
Closed on
Apr 30, 2014
Sold by
Webco Holdings Llc
Bought by
Ed Holt Home Builders Llc
Purchase Details
Closed on
Aug 30, 2012
Sold by
Bratskaya Galina and Radetskaya Galina
Bought by
Halterman Jeremy T and Halterman Kathleen C
Purchase Details
Closed on
Apr 3, 2006
Sold by
Baldridge Donald K and Baldridge Brenda
Bought by
Mcdonald Duke and Mcdonald Kelly
Home Financials for this Owner
Home Financials are based on the most recent Mortgage that was taken out on this home.
Original Mortgage
$96,100
Interest Rate
5.87%
Mortgage Type
New Conventional
Create a Home Valuation Report for This Property
The Home Valuation Report is an in-depth analysis detailing your home's value as well as a comparison with similar homes in the area
Purchase History
| Date | Buyer | Sale Price | Title Company |
|---|---|---|---|
| The Maynard Leroy Lilley And Carol Ann L | -- | None Available | |
| Ed Holt Home Builders Llc | -- | None Available | |
| Halterman Jeremy T | -- | None Available | |
| Mcdonald Duke | -- | Fidelity Title Agency |
Source: Public Records
Mortgage History
| Date | Status | Borrower | Loan Amount |
|---|---|---|---|
| Previous Owner | Mcdonald Duke | $96,100 |
Source: Public Records
Tax History
| Year | Tax Paid | Tax Assessment Tax Assessment Total Assessment is a certain percentage of the fair market value that is determined by local assessors to be the total taxable value of land and additions on the property. | Land | Improvement |
|---|---|---|---|---|
| 2025 | $2,265 | $50,200 | $6,650 | $43,550 |
| 2024 | $2,265 | $40,360 | $5,130 | $35,230 |
| 2023 | $2,253 | $40,360 | $5,130 | $35,230 |
| 2022 | $2,010 | $36,250 | $5,130 | $31,120 |
| 2021 | $2,008 | $36,250 | $5,130 | $31,120 |
| 2020 | $1,918 | $32,850 | $5,130 | $27,720 |
| 2019 | $1,862 | $32,850 | $5,130 | $27,720 |
| 2018 | $1,716 | $30,100 | $5,130 | $24,970 |
| 2017 | $1,700 | $30,800 | $5,130 | $25,670 |
| 2016 | $1,736 | $30,800 | $5,130 | $25,670 |
| 2015 | $1,720 | $30,800 | $5,130 | $25,670 |
| 2014 | $1,719 | $30,510 | $5,130 | $25,380 |
Source: Public Records
Map
Nearby Homes
- 3229 W McClernon St
- 3031 W Augusta Hills St
- 3486 N Ohara Ave
- 3443 W Hestand St
- 3467 W Hestand St
- 3468 W Hestand St
- 000 N Farm Road 127
- 3526 Fratelli Ln
- 3340 W Bellaire St
- 2488 W Farm Road 112
- 2499 W Cedar Creek Dr
- Lot 4 N Full Bright Ave
- 2105 W McClernon St
- 2406 W Spring Water St
- 2744 W Chicago St
- 2469 W Brook Ridge St
- 000 Missouri 13
- Lot 9 N Ethyl Ave
- Lot 11 N Ethyl Ave
- Lot 6 N Farm Rd 139
- 3183 N Morningstar Ave
- 3183 Morning Star Ave
- 2944 W Grandview St
- 3112 W Grandview St
- 3133 W Grandview St
- 3121 W Grandview St
- 3171 Morning Star Ave
- 3171 N Morningstar Ave
- 3148 W Grandview St
- 3180 N Morningstar Ave
- 3109 W Grandview St
- 3100 W Grandview St
- 3169 W Grandview St
- 3160 W Grandview St
- 3097 W Grandview St
- 3088 W Grandview St
- 3181 W Grandview St
- 3181 N Grandview
- 3172 W Grandview St
- 3216 N Farm Road 127
Your Personal Tour Guide
Ask me questions while you tour the home.