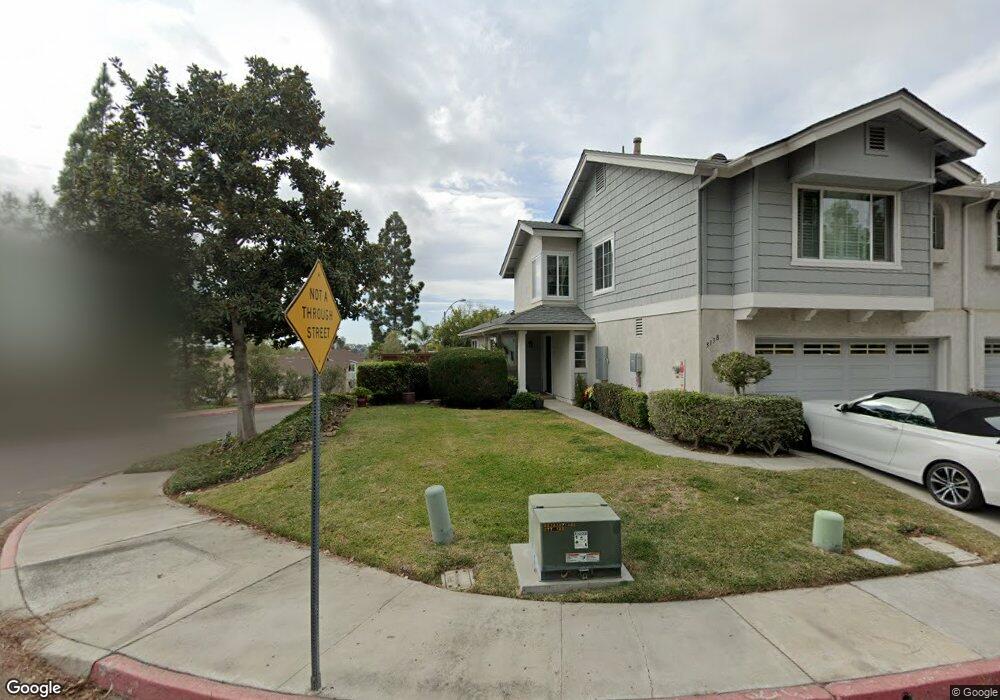
3138 E Fox Run Way San Diego, CA 92111
Clairemont Mesa West NeighborhoodEstimated Value: $993,334 - $1,210,000
3
Beds
3
Baths
1,562
Sq Ft
$686/Sq Ft
Est. Value
About This Home
This home is located at 3138 E Fox Run Way, San Diego, CA 92111 and is currently estimated at $1,070,834, approximately $685 per square foot. 3138 E Fox Run Way is a home located in San Diego County with nearby schools including Holmes Elementary, Marston Middle School, and Clairemont High School.
Ownership History
Date
Name
Owned For
Owner Type
Purchase Details
Closed on
Dec 22, 2000
Sold by
Carreno John J and Carreno Marianna
Bought by
Carreno John Javier and Carreno Marianna Catherina
Current Estimated Value
Purchase Details
Closed on
Sep 10, 1995
Sold by
Howard Norman D and Howard Sherry R
Bought by
Carreno John J and Carreno Marianna
Home Financials for this Owner
Home Financials are based on the most recent Mortgage that was taken out on this home.
Original Mortgage
$183,600
Interest Rate
7.8%
Mortgage Type
Assumption
Purchase Details
Closed on
Dec 13, 1991
Purchase Details
Closed on
May 2, 1983
Create a Home Valuation Report for This Property
The Home Valuation Report is an in-depth analysis detailing your home's value as well as a comparison with similar homes in the area
Home Values in the Area
Average Home Value in this Area
Purchase History
| Date | Buyer | Sale Price | Title Company |
|---|---|---|---|
| Carreno John Javier | -- | -- | |
| Carreno John J | $180,000 | Chicago Title Co | |
| -- | $197,500 | -- | |
| -- | $101,900 | -- |
Source: Public Records
Mortgage History
| Date | Status | Borrower | Loan Amount |
|---|---|---|---|
| Closed | Carreno John J | $183,600 |
Source: Public Records
Tax History Compared to Growth
Tax History
| Year | Tax Paid | Tax Assessment Tax Assessment Total Assessment is a certain percentage of the fair market value that is determined by local assessors to be the total taxable value of land and additions on the property. | Land | Improvement |
|---|---|---|---|---|
| 2025 | $3,549 | $298,993 | $118,021 | $180,972 |
| 2024 | $3,549 | $293,131 | $115,707 | $177,424 |
| 2023 | $3,469 | $287,385 | $113,439 | $173,946 |
| 2022 | $3,375 | $281,751 | $111,215 | $170,536 |
| 2021 | $3,350 | $276,228 | $109,035 | $167,193 |
| 2020 | $3,309 | $273,396 | $107,917 | $165,479 |
| 2019 | $3,249 | $268,036 | $105,801 | $162,235 |
| 2018 | $3,037 | $262,781 | $103,727 | $159,054 |
| 2017 | $80 | $257,630 | $101,694 | $155,936 |
| 2016 | $2,913 | $252,579 | $99,700 | $152,879 |
| 2015 | $2,869 | $248,786 | $98,203 | $150,583 |
| 2014 | $2,824 | $243,914 | $96,280 | $147,634 |
Source: Public Records
Map
Nearby Homes
- 3014 Old Bridgeport Way
- 3120 Old Bridgeport Way
- 3047 Old Bridgeport Way
- 3226 Old Heather Rd
- 3218 Old Bridgeport Way
- 3298 Old Heather Rd
- 3270 W Fox Run Way Unit 2
- 3262 Mount Carol Dr
- 3710 Old Cobble Rd
- 3161 Mount Tami Dr
- 3516 Old Cobble Rd
- 5581 Mount Acara Dr
- 3405 Aveley Place
- 3413 Rollsreach Dr
- 6929 Park Mesa Way Unit 126
- 3581 Mount Abbey Ave
- 2868-70 Preece St
- 3173 Via Arcilla
- 2818 Nye St
- 2750 Wheatstone St Unit 110
- 3144 E Fox Run Way
- 3150 E Fox Run Way
- 3156 E Fox Run Way
- 3132 E Fox Run Way
- 2953 Old Bridgeport Way
- 2955 Old Bridgeport Way
- 3124 Old Heather Rd
- 3162 E Fox Run Way
- 3126 E Fox Run Way
- 3130 Old Heather Rd
- 3095 E Fox Run Way Unit 3
- 2957 Old Bridgeport Way
- 3133 Old Kettle Rd
- 3123 Old Kettle Rd
- 3129 Old Kettle Rd
- 3136 Old Heather Rd
- 3168 E Fox Run Way
- 3119 Old Kettle Rd
- 3093 E Fox Run Way
- 2959 Old Bridgeport Way Unit 3