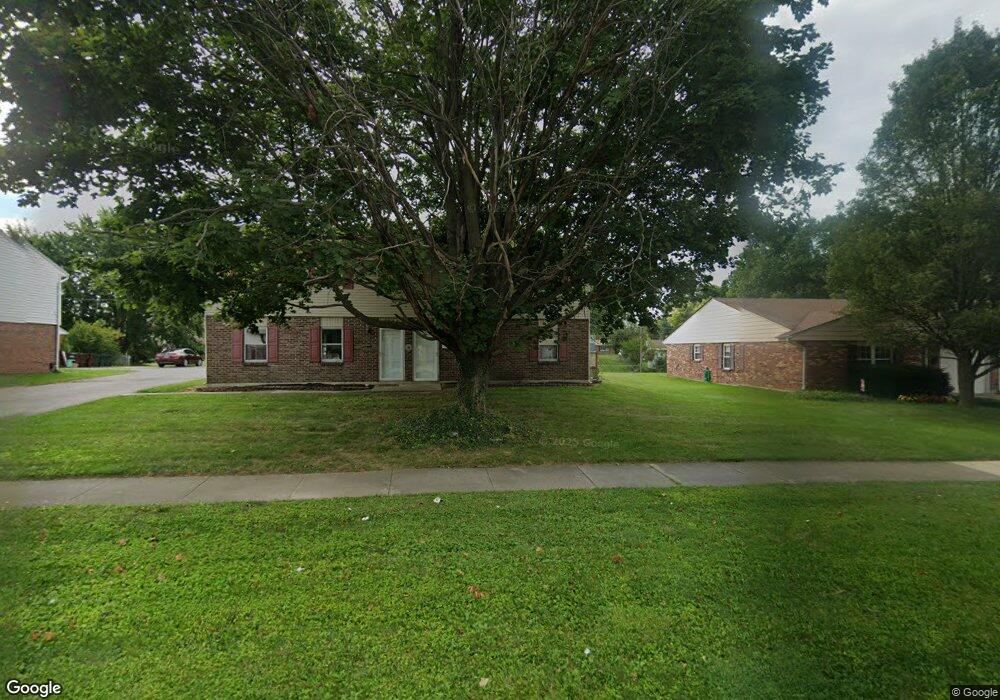
3138 E Stroop Rd Kettering, OH 45440
Estimated Value: $198,000 - $383,727
6
Beds
6
Baths
2,880
Sq Ft
$107/Sq Ft
Est. Value
About This Home
This home is located at 3138 E Stroop Rd, Kettering, OH 45440 and is currently estimated at $307,932, approximately $106 per square foot. 3138 E Stroop Rd is a home located in Montgomery County with nearby schools including Prass Elementary School, Kettering Middle School, and Kettering Fairmont High School.
Ownership History
Date
Name
Owned For
Owner Type
Purchase Details
Closed on
Nov 25, 2020
Sold by
Dawson Jaderic C and Dawson Brittany
Bought by
Ia Rentals Llc
Current Estimated Value
Home Financials for this Owner
Home Financials are based on the most recent Mortgage that was taken out on this home.
Original Mortgage
$200,000
Interest Rate
2.67%
Mortgage Type
Commercial
Purchase Details
Closed on
Oct 5, 2012
Sold by
Cox Lyndon W and Cox Melissa E
Bought by
Dawson Jaderic C
Home Financials for this Owner
Home Financials are based on the most recent Mortgage that was taken out on this home.
Original Mortgage
$170,848
Interest Rate
3.53%
Mortgage Type
FHA
Purchase Details
Closed on
Oct 31, 2003
Sold by
Davis Debra L
Bought by
Cox Lyndon W and Cox Melissa E
Purchase Details
Closed on
Aug 7, 2001
Sold by
Vanoss Marilyn
Bought by
Davis Debra L
Home Financials for this Owner
Home Financials are based on the most recent Mortgage that was taken out on this home.
Original Mortgage
$168,337
Interest Rate
7.28%
Mortgage Type
FHA
Create a Home Valuation Report for This Property
The Home Valuation Report is an in-depth analysis detailing your home's value as well as a comparison with similar homes in the area
Home Values in the Area
Average Home Value in this Area
Purchase History
| Date | Buyer | Sale Price | Title Company |
|---|---|---|---|
| Ia Rentals Llc | $250,000 | Landmark Ttl Agcy South Inc | |
| Dawson Jaderic C | $174,000 | None Available | |
| Cox Lyndon W | $183,000 | -- | |
| Davis Debra L | $171,000 | -- |
Source: Public Records
Mortgage History
| Date | Status | Borrower | Loan Amount |
|---|---|---|---|
| Previous Owner | Ia Rentals Llc | $200,000 | |
| Previous Owner | Dawson Jaderic C | $170,848 | |
| Previous Owner | Davis Debra L | $168,337 |
Source: Public Records
Tax History
| Year | Tax Paid | Tax Assessment Tax Assessment Total Assessment is a certain percentage of the fair market value that is determined by local assessors to be the total taxable value of land and additions on the property. | Land | Improvement |
|---|---|---|---|---|
| 2025 | $6,745 | $104,400 | $14,800 | $89,600 |
| 2024 | $6,555 | $104,400 | $14,800 | $89,600 |
| 2023 | $6,555 | $104,400 | $14,800 | $89,600 |
| 2022 | $6,584 | $83,230 | $11,840 | $71,390 |
| 2021 | $6,094 | $83,230 | $11,840 | $71,390 |
| 2020 | $6,084 | $83,230 | $11,840 | $71,390 |
| 2019 | $5,325 | $64,680 | $11,840 | $52,840 |
| 2018 | $5,353 | $64,680 | $11,840 | $52,840 |
| 2017 | $4,931 | $64,680 | $11,840 | $52,840 |
| 2016 | $4,614 | $56,300 | $11,840 | $44,460 |
| 2015 | $4,365 | $56,300 | $11,840 | $44,460 |
| 2014 | $4,365 | $56,300 | $11,840 | $44,460 |
| 2012 | -- | $58,550 | $11,080 | $47,470 |
Source: Public Records
Map
Nearby Homes
- 3170 E Stroop Rd Unit 103
- 4485 Sentry Hill Ct
- 4426 Woodbank Dr
- 430 Craftsbury Ct
- 2776 Corlington Dr
- 2816 Corlington Dr
- 2716 Hemphill Rd
- 4086 Glenheath Dr
- 3041 Revlon Dr
- 3167 Gracemore Ave
- 2364 Hemphill Rd
- 4408 Glenheath Dr
- 241 Grand Vista Dr
- 4416 Timberwilde Dr
- 3313 Braddock St
- 861 Acorn Dr
- 4524 Drayton Ct
- 4201 Rushmore Place
- 410 Tanglewood Dr
- 2951 Swigert Rd
- 3138 E Stroop Rd Unit 2
- 3150 E Stroop Rd
- 3126 E Stroop Rd
- 3114 E Stroop Rd
- 3114 E Stroop Rd Unit 3114
- 3114 E Stroop Rd Unit 3120
- 3159 Santa Rosa Dr
- 3147 Santa Rosa Dr
- 3995 San Marino St
- 3135 Santa Rosa Dr
- 3997 San Marino St
- 3171 Santa Rosa Dr
- 3171 Santa Rosa Dr
- 3102 E Stroop Rd
- 3108 E Stroop Rd
- 3123 Santa Rosa Dr
- 3097 E Stroop Rd Unit 3097
- 3121 E Stroop Rd
- 3109 E Stroop Rd
- 3115 E Stroop Rd
Your Personal Tour Guide
Ask me questions while you tour the home.