Estimated Value: $679,000 - $730,895
3
Beds
2
Baths
3,400
Sq Ft
$206/Sq Ft
Est. Value
About This Home
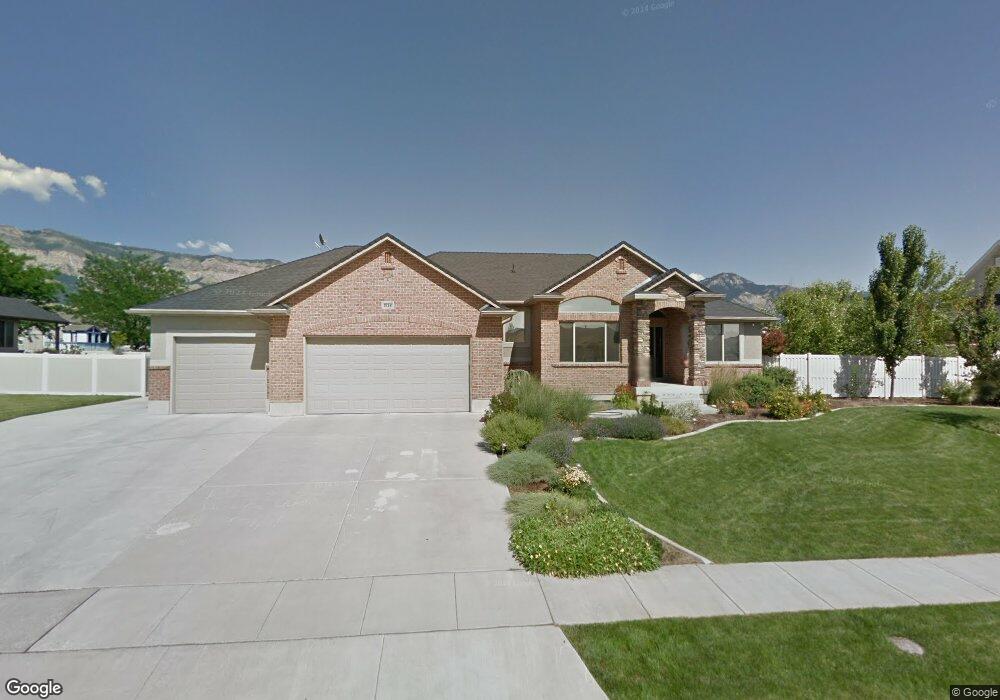
This home is located at 3138 N 750 W, Ogden, UT 84414 and is currently estimated at $699,974, approximately $205 per square foot. 3138 N 750 W is a home located in Weber County with nearby schools including Orion Junior High School, Weber High School, and Maria Montessori Academy.
Ownership History
Date
Name
Owned For
Owner Type
Purchase Details
Closed on
Feb 22, 2018
Sold by
Moyes Douglas W and Moyes Mendie C
Bought by
Moyes Douglas W and Moyes Mendie C
Current Estimated Value
Home Financials for this Owner
Home Financials are based on the most recent Mortgage that was taken out on this home.
Original Mortgage
$300,000
Outstanding Balance
$254,073
Interest Rate
3.99%
Mortgage Type
Purchase Money Mortgage
Estimated Equity
$445,901
Purchase Details
Closed on
Jan 14, 2005
Sold by
Bridgerland Builders Inc
Bought by
Moyes Douglas W and Moyes Mendie C
Purchase Details
Closed on
Mar 18, 2004
Sold by
Highland Investments Llc
Bought by
Bridgerland Builders Inc
Create a Home Valuation Report for This Property
The Home Valuation Report is an in-depth analysis detailing your home's value as well as a comparison with similar homes in the area
Home Values in the Area
Average Home Value in this Area
Purchase History
| Date | Buyer | Sale Price | Title Company |
|---|---|---|---|
| Moyes Douglas W | -- | Security Title Of Davis Coun | |
| Moyes Douglas W | -- | Bonneville Title Company Cle | |
| Bridgerland Builders Inc | -- | Equity Title |
Source: Public Records
Mortgage History
| Date | Status | Borrower | Loan Amount |
|---|---|---|---|
| Open | Moyes Douglas W | $300,000 |
Source: Public Records
Tax History Compared to Growth
Tax History
| Year | Tax Paid | Tax Assessment Tax Assessment Total Assessment is a certain percentage of the fair market value that is determined by local assessors to be the total taxable value of land and additions on the property. | Land | Improvement |
|---|---|---|---|---|
| 2025 | $4,131 | $669,724 | $230,041 | $439,683 |
| 2024 | $4,131 | $362,449 | $126,522 | $235,927 |
| 2023 | $4,100 | $362,450 | $126,499 | $235,951 |
| 2022 | $4,048 | $366,300 | $99,000 | $267,300 |
| 2021 | $3,583 | $548,000 | $115,000 | $433,000 |
| 2020 | $3,215 | $452,000 | $95,009 | $356,991 |
| 2019 | $3,064 | $410,000 | $85,017 | $324,983 |
| 2018 | $3,057 | $438,000 | $80,015 | $357,985 |
| 2017 | $3,066 | $373,000 | $80,015 | $292,985 |
| 2016 | $2,711 | $178,475 | $43,954 | $134,521 |
| 2015 | $2,724 | $178,288 | $43,954 | $134,334 |
| 2014 | $2,282 | $144,326 | $38,542 | $105,784 |
Source: Public Records
Map
Nearby Homes
- 3234 N 550 W
- 3011 N 1000 W
- 747 W 2775 N
- 615 Fox Meadow Dr
- 759 W Fox Meadow Dr
- 2717 N 825 W Unit 28
- 38 White Barn Dr
- 42 White Barn Dr
- 48 White Barn Dr
- 0 W Pleasant View Dr
- 1573 W 2700 N
- 310 W 3275 N Unit 47
- 307 Willow Way
- 483 W 3500 N
- 1003 W 3350 N
- Ontario Farmhouse Plan at Weber View
- Sorrento Traditional Plan at Weber View
- Yorktown Traditional Plan at Weber View
- Lincoln Farmhouse Plan at Weber View
- 769 W 3650 N