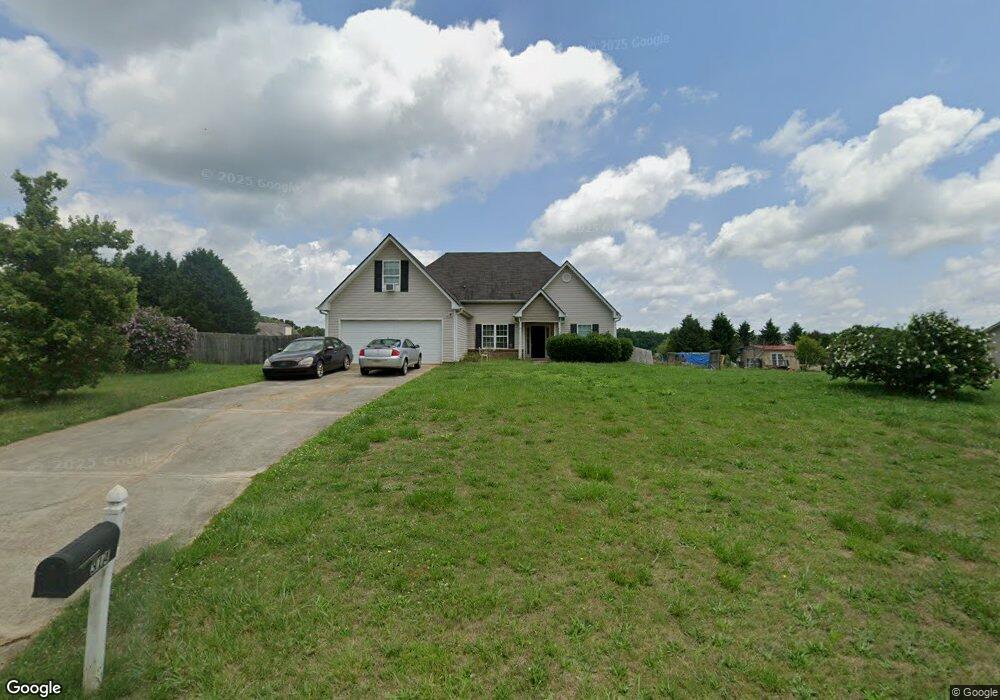
314 Anchors Way Unit 34 Winder, GA 30680
Estimated Value: $336,000 - $368,000
3
Beds
2
Baths
1,682
Sq Ft
$206/Sq Ft
Est. Value
About This Home
This home is located at 314 Anchors Way Unit 34, Winder, GA 30680 and is currently estimated at $345,912, approximately $205 per square foot. 314 Anchors Way Unit 34 is a home located in Barrow County with nearby schools including Statham Elementary School, Bear Creek Middle School, and Winder-Barrow High School.
Ownership History
Date
Name
Owned For
Owner Type
Purchase Details
Closed on
Jan 9, 2015
Sold by
Cooper Eddie C
Bought by
Nichols Carlos J
Current Estimated Value
Purchase Details
Closed on
Aug 14, 2009
Sold by
Washington Mutuaal Wma Trust
Bought by
Cooper Eddie C
Purchase Details
Closed on
Jan 6, 2009
Sold by
Pettit Timothy A
Bought by
Bank Of America
Purchase Details
Closed on
Oct 31, 2006
Sold by
Jhr Construction Llc
Bought by
Pettit Timothy A
Home Financials for this Owner
Home Financials are based on the most recent Mortgage that was taken out on this home.
Original Mortgage
$112,720
Interest Rate
7.75%
Mortgage Type
New Conventional
Purchase Details
Closed on
Jun 30, 2006
Sold by
Trammell Construction Co Inc
Bought by
Jhr Construction Llc
Purchase Details
Closed on
Apr 28, 2006
Sold by
R & S Developers Llc
Bought by
Trammell Construction Co Inc
Purchase Details
Closed on
Jul 2, 2004
Bought by
R & S Developers Llc
Create a Home Valuation Report for This Property
The Home Valuation Report is an in-depth analysis detailing your home's value as well as a comparison with similar homes in the area
Home Values in the Area
Average Home Value in this Area
Purchase History
| Date | Buyer | Sale Price | Title Company |
|---|---|---|---|
| Nichols Carlos J | $117,000 | -- | |
| Cooper Eddie C | $84,500 | -- | |
| Bank Of America | -- | -- | |
| Pettit Timothy A | $140,900 | -- | |
| Jhr Construction Llc | $40,000 | -- | |
| Trammell Construction Co Inc | $36,500 | -- | |
| R & S Developers Llc | -- | -- |
Source: Public Records
Mortgage History
| Date | Status | Borrower | Loan Amount |
|---|---|---|---|
| Previous Owner | Pettit Timothy A | $112,720 |
Source: Public Records
Tax History Compared to Growth
Tax History
| Year | Tax Paid | Tax Assessment Tax Assessment Total Assessment is a certain percentage of the fair market value that is determined by local assessors to be the total taxable value of land and additions on the property. | Land | Improvement |
|---|---|---|---|---|
| 2024 | $2,765 | $108,996 | $24,000 | $84,996 |
| 2023 | $2,680 | $105,796 | $20,400 | $85,396 |
| 2022 | $2,204 | $74,224 | $20,400 | $53,824 |
| 2021 | $2,196 | $69,824 | $16,000 | $53,824 |
| 2020 | $2,200 | $69,824 | $16,000 | $53,824 |
| 2019 | $1,929 | $59,643 | $16,000 | $43,643 |
| 2018 | $1,834 | $57,243 | $13,600 | $43,643 |
| 2017 | $1,289 | $44,285 | $13,600 | $30,685 |
| 2016 | $1,436 | $44,618 | $13,600 | $31,018 |
| 2015 | $1,452 | $44,950 | $13,600 | $31,350 |
| 2014 | $1,317 | $39,131 | $7,448 | $31,683 |
| 2013 | -- | $37,560 | $7,448 | $30,112 |
Source: Public Records
Map
Nearby Homes
- 1212 Highway 211 NE
- 1226 Highway 211 NE
- 315 Paige Way
- 1023 Solomon Ct
- 1453 Solomon Dr
- 130 (Tract 1) Bowman Mill Rd NE
- 917 Justin Dr Unit 3
- 1431 Solomon Dr
- 1206 Corkybrooke Ln
- 130 Bowman Mill Rd NE Unit 1
- 385 Finch Landing Rd
- 212 Rainbow Ln
- 1593 Highway 82
- 614 Anns Way
- 29 Nunnally Rd SE
- 1415 Red Oak Way
- 388 Kay Dr Unit 1
- 1553 Shoal Creek Dr
- 1642 White Oak Dr
- 1556 Shoal Creek Dr
- 314 Anchors Way
- 318 Anchors Way
- 202 Ballast Trail
- 105 Bower Ct
- 107 Bower Ct
- 308 Anchors Way
- 313 Anchors Way
- 204 Ballast Trail
- 315 Anchors Way
- 311 Anchors Way
- 109 Bower Ct
- 317 Anchors Way
- 319 Anchors Way
- 309 Anchor Way (5)
- 201 Ballast Trail
- 309 Anchors Way
- 319 Anchor Way (10)
- 111 Bower Ct
- 205 Ballast Trail