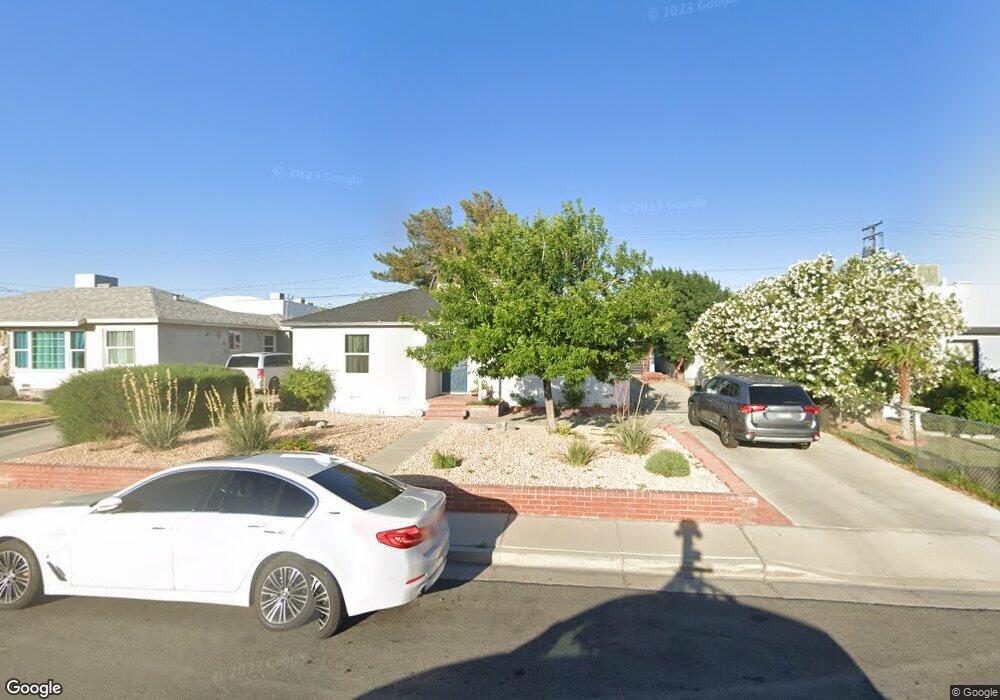
314 Balsam St Ridgecrest, CA 93555
Estimated Value: $157,000 - $183,000
3
Beds
1
Bath
1,052
Sq Ft
$161/Sq Ft
Est. Value
About This Home
This home is located at 314 Balsam St, Ridgecrest, CA 93555 and is currently estimated at $169,363, approximately $160 per square foot. 314 Balsam St is a home located in Kern County with nearby schools including Las Flores Elementary School, James Monroe Middle School, and Burroughs High School.
Ownership History
Date
Name
Owned For
Owner Type
Purchase Details
Closed on
Jan 8, 2015
Sold by
Almaraz Beverley
Bought by
Sauter Kemila L
Current Estimated Value
Home Financials for this Owner
Home Financials are based on the most recent Mortgage that was taken out on this home.
Original Mortgage
$77,865
Outstanding Balance
$59,242
Interest Rate
3.66%
Mortgage Type
New Conventional
Estimated Equity
$110,121
Purchase Details
Closed on
Aug 23, 2006
Sold by
Almaraz Julian H
Bought by
Almaraz Beverley J
Home Financials for this Owner
Home Financials are based on the most recent Mortgage that was taken out on this home.
Original Mortgage
$87,685
Interest Rate
6.51%
Mortgage Type
Purchase Money Mortgage
Purchase Details
Closed on
Aug 10, 2006
Sold by
Griffith Glen Martin
Bought by
Almaraz Beverley
Home Financials for this Owner
Home Financials are based on the most recent Mortgage that was taken out on this home.
Original Mortgage
$87,685
Interest Rate
6.51%
Mortgage Type
Purchase Money Mortgage
Create a Home Valuation Report for This Property
The Home Valuation Report is an in-depth analysis detailing your home's value as well as a comparison with similar homes in the area
Home Values in the Area
Average Home Value in this Area
Purchase History
| Date | Buyer | Sale Price | Title Company |
|---|---|---|---|
| Sauter Kemila L | $85,000 | Placer Title Company | |
| Almaraz Beverley J | -- | Alliance Title Company | |
| Almaraz Beverley | $135,000 | Alliance Title Company |
Source: Public Records
Mortgage History
| Date | Status | Borrower | Loan Amount |
|---|---|---|---|
| Open | Sauter Kemila L | $77,865 | |
| Previous Owner | Almaraz Beverley | $87,685 |
Source: Public Records
Tax History Compared to Growth
Tax History
| Year | Tax Paid | Tax Assessment Tax Assessment Total Assessment is a certain percentage of the fair market value that is determined by local assessors to be the total taxable value of land and additions on the property. | Land | Improvement |
|---|---|---|---|---|
| 2025 | $1,583 | $102,149 | $24,033 | $78,116 |
| 2024 | $1,540 | $100,147 | $23,562 | $76,585 |
| 2023 | $1,540 | $98,184 | $23,100 | $75,084 |
| 2022 | $1,508 | $96,260 | $22,648 | $73,612 |
| 2021 | $1,441 | $94,373 | $22,204 | $72,169 |
| 2020 | $1,402 | $93,406 | $21,977 | $71,429 |
| 2019 | $1,382 | $93,406 | $21,977 | $71,429 |
| 2018 | $1,360 | $89,781 | $21,125 | $68,656 |
| 2017 | $1,355 | $88,021 | $20,711 | $67,310 |
| 2016 | $1,305 | $86,296 | $20,305 | $65,991 |
| 2015 | $1,196 | $70,000 | $18,000 | $52,000 |
| 2014 | $1,088 | $70,000 | $18,000 | $52,000 |
Source: Public Records
Map
Nearby Homes
- 309 N Fairview St
- 408 N Warner St
- 233 N Fairview St
- 432 N Warner St
- 225 W French Ave
- 241 W French Ave
- 320 N Helena St
- 304 N Helena St
- 233 N Alvord St
- 304 Panamint Ave
- 308 Panamint Ave
- 225 N Alvord St
- 0 Ridgecrest Blvd Unit 2607074
- 0 Ridgecrest Blvd Unit 456-09 2607013
- 0 Ridgecrest Blvd
- 417 Argus Ave
- 304 Palm Dr Unit G
- 333 N Florence St
- 224 N Florence St
- 317 N Gold Canyon St