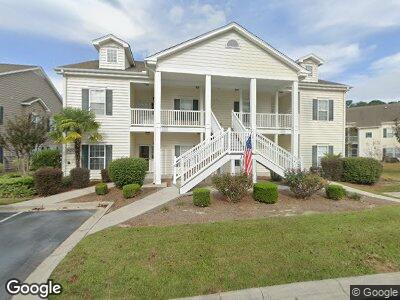
314 Black Oak Ln Unit 31410 Murrells Inlet, SC 29576
Burgess NeighborhoodEstimated Value: $252,000 - $275,000
3
Beds
2
Baths
1,411
Sq Ft
$185/Sq Ft
Est. Value
About This Home
This home is located at 314 Black Oak Ln Unit 31410, Murrells Inlet, SC 29576 and is currently estimated at $261,687, approximately $185 per square foot. 314 Black Oak Ln Unit 31410 is a home located in Horry County with nearby schools including St. James Elementary School, St. James Middle School, and St. James Intermediate.
Ownership History
Date
Name
Owned For
Owner Type
Purchase Details
Closed on
May 25, 2022
Sold by
Horst Robert P
Bought by
Viglione John David and Viglione Teresa Ann
Current Estimated Value
Purchase Details
Closed on
Aug 27, 2019
Sold by
Strine Barry L
Bought by
Horst Robert P and Horst Jane A
Home Financials for this Owner
Home Financials are based on the most recent Mortgage that was taken out on this home.
Original Mortgage
$124,000
Interest Rate
3.7%
Mortgage Type
New Conventional
Purchase Details
Closed on
Nov 27, 2013
Sold by
Strine Karen L
Bought by
Strine Barry L
Home Financials for this Owner
Home Financials are based on the most recent Mortgage that was taken out on this home.
Original Mortgage
$101,236
Interest Rate
4.29%
Mortgage Type
New Conventional
Purchase Details
Closed on
Apr 2, 2009
Sold by
Strine Barry L
Bought by
Strine Barry L
Create a Home Valuation Report for This Property
The Home Valuation Report is an in-depth analysis detailing your home's value as well as a comparison with similar homes in the area
Home Values in the Area
Average Home Value in this Area
Purchase History
| Date | Buyer | Sale Price | Title Company |
|---|---|---|---|
| Viglione John David | $275,000 | -- | |
| Horst Robert P | $155,000 | -- | |
| Strine Barry L | -- | -- | |
| Strine Barry L | -- | -- | |
| Strine Barry L | -- | -- |
Source: Public Records
Mortgage History
| Date | Status | Borrower | Loan Amount |
|---|---|---|---|
| Previous Owner | Horst Robert P | $124,000 | |
| Previous Owner | Strine Barry L | $101,236 | |
| Previous Owner | Strine Barry L | $80,000 |
Source: Public Records
Tax History Compared to Growth
Tax History
| Year | Tax Paid | Tax Assessment Tax Assessment Total Assessment is a certain percentage of the fair market value that is determined by local assessors to be the total taxable value of land and additions on the property. | Land | Improvement |
|---|---|---|---|---|
| 2024 | $3,259 | $16,244 | $0 | $16,244 |
| 2023 | $3,259 | $16,244 | $0 | $16,244 |
| 2021 | $1,983 | $16,244 | $0 | $16,244 |
| 2020 | $1,886 | $16,244 | $0 | $16,244 |
| 2019 | $1,537 | $15,120 | $0 | $15,120 |
| 2018 | $0 | $11,445 | $0 | $11,445 |
| 2017 | $1,373 | $11,445 | $0 | $11,445 |
| 2016 | -- | $11,445 | $0 | $11,445 |
| 2015 | $1,420 | $4,360 | $0 | $4,360 |
| 2014 | -- | $4,360 | $0 | $4,360 |
Source: Public Records
Map
Nearby Homes
- 307 Black Oak Ln Unit 102
- 411 Mahogany Dr Unit 202 Marcliffe West
- 442 Mahogany Dr Unit 101
- tbd Aft Ct Unit 101
- 662 Sunnyside Dr Unit 101
- 339 Black Oak Ln Unit 201
- 620 Sunnyside Dr Unit 102
- 5870 Longwood Dr Unit 203
- 822 Sail Ln Unit 103
- 5876 Longwood Dr Unit 201
- 249 Moonglow Cir Unit 201
- 5882 Longwood Dr Unit 201
- 5882 Longwood Dr Unit 204
- 1000 Red Sky Ln Unit 101
- 5846 Longwood Dr Unit 302
- 1018 Red Sky Ln Unit 101
- 1652 Murrell Place
- 5840 Longwood Dr Unit 303
- 5810 Longwood Dr Unit 201
- 5810 Longwood Dr Unit 14-304
- 314 Black Oak Ln
- 314 Black Oak Ln Unit 31410
- 314 Black Oak Ln Unit 31420
- 314 Black Oak Ln Unit 31420
- 314 Black Oak Ln Unit 31410
- 314 Black Oak Ln Unit 202
- 314 Black Oak Ln Unit 201
- 314 Black Oak Ln Unit 102
- 320 Black Oak Ln Unit 32010
- 320 Black Oak Ln Unit 32020
- 320 Black Oak Ln Unit 32020
- 320 Black Oak Ln Unit 32010
- 320 Black Oak Ln
- 320 Black Oak Ln Unit 101
- 320 Black Oak Ln Unit 202
- 429 Mahogany Dr Unit 102
- 429 Mahogany Dr
- 429 Mahogany Dr Unit 42910
- 429 Mahogany Dr Unit 42920
- 429 Mahogany Dr Unit 42920