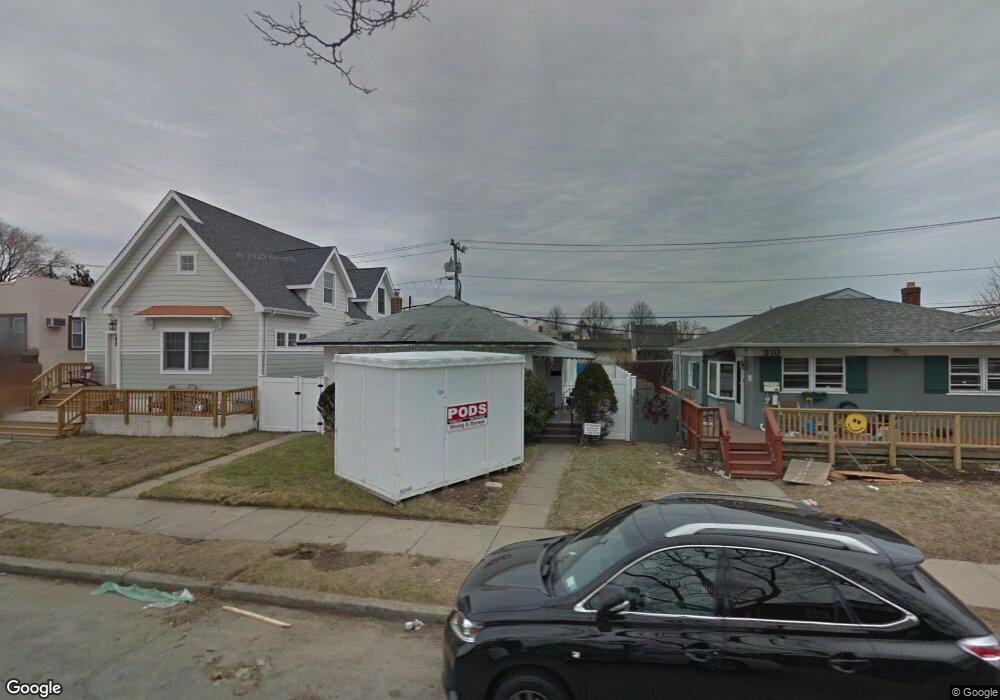
314 E Chester St Long Beach, NY 11561
Estimated Value: $713,000 - $713,633
3
Beds
2
Baths
1,348
Sq Ft
$529/Sq Ft
Est. Value
About This Home
This home is located at 314 E Chester St, Long Beach, NY 11561 and is currently estimated at $713,317, approximately $529 per square foot. 314 E Chester St is a home located in Nassau County with nearby schools including Lido Elementary School, East Elementary School, and Lindell Elementary School.
Ownership History
Date
Name
Owned For
Owner Type
Purchase Details
Closed on
Mar 29, 2019
Sold by
Bernstein Daniel and Bernstein Rachel
Bought by
Bernstein Rachel
Current Estimated Value
Purchase Details
Closed on
Jun 5, 2017
Sold by
Degillo Gilb Ert and Degillo Sheila
Bought by
Bernstein Rachel and Bernstein Daniel
Home Financials for this Owner
Home Financials are based on the most recent Mortgage that was taken out on this home.
Original Mortgage
$390,000
Outstanding Balance
$324,399
Interest Rate
4.02%
Mortgage Type
New Conventional
Estimated Equity
$388,918
Purchase Details
Closed on
Nov 2, 2009
Sold by
Lantner David and Lantner Mariama
Bought by
Degillo Gilbert and Degillo Sheila
Home Financials for this Owner
Home Financials are based on the most recent Mortgage that was taken out on this home.
Original Mortgage
$433,012
Interest Rate
4.98%
Mortgage Type
FHA
Purchase Details
Closed on
Dec 28, 2007
Sold by
Naft Rose
Bought by
Lantner David
Create a Home Valuation Report for This Property
The Home Valuation Report is an in-depth analysis detailing your home's value as well as a comparison with similar homes in the area
Home Values in the Area
Average Home Value in this Area
Purchase History
| Date | Buyer | Sale Price | Title Company |
|---|---|---|---|
| Bernstein Rachel | -- | Westcor Land Title Ins Co | |
| Bernstein Rachel | $490,000 | Ram Abstract Ltd | |
| Degillo Gilbert | $441,000 | -- | |
| Lantner David | $416,000 | -- |
Source: Public Records
Mortgage History
| Date | Status | Borrower | Loan Amount |
|---|---|---|---|
| Open | Bernstein Rachel | $390,000 | |
| Previous Owner | Degillo Gilbert | $433,012 |
Source: Public Records
Tax History Compared to Growth
Tax History
| Year | Tax Paid | Tax Assessment Tax Assessment Total Assessment is a certain percentage of the fair market value that is determined by local assessors to be the total taxable value of land and additions on the property. | Land | Improvement |
|---|---|---|---|---|
| 2025 | $6,897 | $479 | $197 | $282 |
| 2024 | $898 | $479 | $197 | $282 |
| 2023 | $7,199 | $479 | $197 | $282 |
| 2022 | $7,199 | $479 | $197 | $282 |
| 2021 | $14,345 | $459 | $189 | $270 |
| 2020 | $10,988 | $859 | $703 | $156 |
| 2019 | $8,063 | $820 | $703 | $117 |
| 2018 | $7,288 | $774 | $0 | $0 |
| 2017 | $4,879 | $859 | $703 | $156 |
| 2016 | $1,060 | $859 | $703 | $156 |
| 2015 | $1,056 | $860 | $703 | $157 |
| 2014 | $1,056 | $860 | $703 | $157 |
| 2013 | $757 | $645 | $527 | $118 |
Source: Public Records
Map
Nearby Homes
- 345 E Park Ave
- 228 E Market St
- 360 E Hudson St
- 213 E Market St
- 342 E Fulton St
- 344 E Fulton St
- 257 E Olive St
- 318 E Olive St
- 345 E Beech St
- 340 E Pine St
- 347 E Pine St
- 460 E Market St
- 272 E Harrison St
- 151 E Olive St
- 709 Monroe Blvd
- 155 Monroe Blvd Unit 155
- 333 E Broadway Unit 3B
- 333 E Broadway Unit 2C
- 255 E Broadway Unit 303
- 223 E Broadway
- 316 E Chester St
- 320 E Chester St Unit Lower
- 320 E Chester St
- 310 E Chester St
- 310 E Chester St
- 324 E Chester St
- 324 E Chester St Unit Upper
- 452 Monroe Blvd
- 315 E Chester St
- 328 E Chester St
- 325 E Park Ave
- 325 E Park Ave Unit Upper
- 325 E Park Ave Unit Office
- 319 E Chester St
- 460 Monroe Blvd
- 460 Monroe Blvd Unit Upper
- 323 E Chester St
- 0 Monroe Blvd Unit 2880953
- 0 Monroe Blvd Unit 2786975
- 332 E Chester St