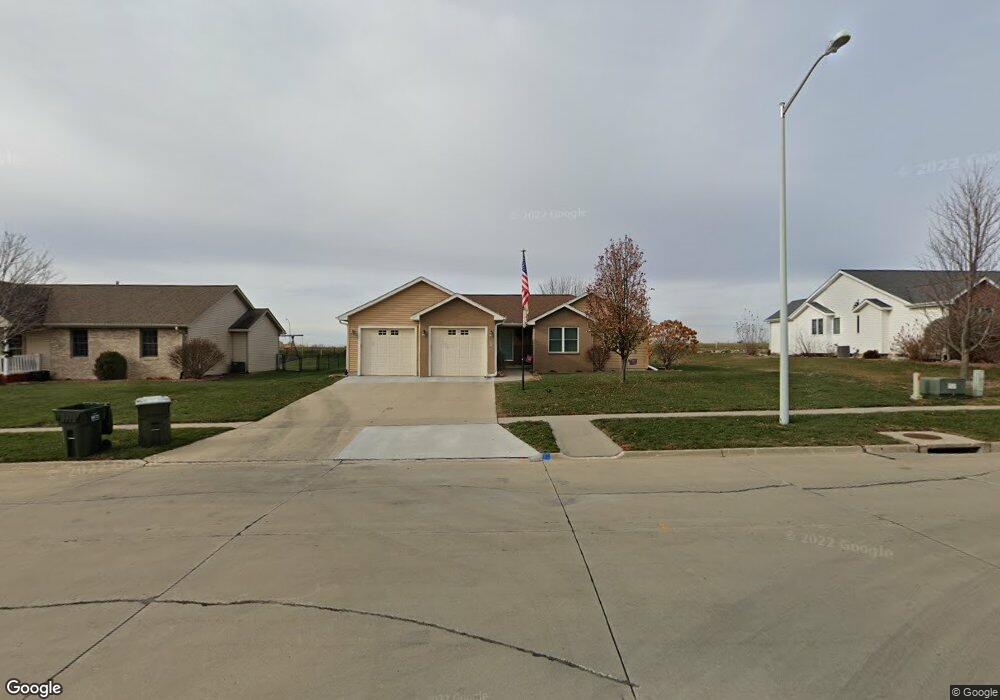
314 Linden St Baxter, IA 50028
Estimated Value: $289,000 - $322,000
3
Beds
2
Baths
1,444
Sq Ft
$209/Sq Ft
Est. Value
About This Home
This home is located at 314 Linden St, Baxter, IA 50028 and is currently estimated at $302,040, approximately $209 per square foot. 314 Linden St is a home located in Jasper County with nearby schools including Baxter Elementary School and Baxter High School.
Ownership History
Date
Name
Owned For
Owner Type
Purchase Details
Closed on
Sep 2, 2018
Sold by
Bonney Ashley A and Bonney Joshua M
Bought by
Booney Ashley A and Hill Jason
Current Estimated Value
Purchase Details
Closed on
Aug 27, 2005
Sold by
Baxter Economic Developement Corp
Bought by
Alpha Group Llc
Home Financials for this Owner
Home Financials are based on the most recent Mortgage that was taken out on this home.
Original Mortgage
$160,000
Interest Rate
5.82%
Mortgage Type
Construction
Create a Home Valuation Report for This Property
The Home Valuation Report is an in-depth analysis detailing your home's value as well as a comparison with similar homes in the area
Home Values in the Area
Average Home Value in this Area
Purchase History
| Date | Buyer | Sale Price | Title Company |
|---|---|---|---|
| Booney Ashley A | -- | -- | |
| Alpha Group Llc | $23,500 | None Available |
Source: Public Records
Mortgage History
| Date | Status | Borrower | Loan Amount |
|---|---|---|---|
| Previous Owner | Alpha Group Llc | $160,000 |
Source: Public Records
Tax History Compared to Growth
Tax History
| Year | Tax Paid | Tax Assessment Tax Assessment Total Assessment is a certain percentage of the fair market value that is determined by local assessors to be the total taxable value of land and additions on the property. | Land | Improvement |
|---|---|---|---|---|
| 2025 | $4,866 | $304,750 | $39,780 | $264,970 |
| 2024 | $4,866 | $277,420 | $39,780 | $237,640 |
| 2023 | $4,852 | $277,420 | $39,780 | $237,640 |
| 2022 | $4,374 | $226,500 | $39,780 | $186,720 |
| 2021 | $4,094 | $208,920 | $39,780 | $169,140 |
| 2020 | $4,094 | $184,870 | $29,470 | $155,400 |
| 2019 | $3,490 | $0 | $0 | $0 |
| 2018 | $3,490 | $160,940 | $0 | $0 |
| 2017 | $3,414 | $160,940 | $0 | $0 |
| 2016 | $3,414 | $159,870 | $0 | $0 |
| 2015 | $3,314 | $159,870 | $0 | $0 |
| 2014 | $3,300 | $159,870 | $0 | $0 |
Source: Public Records
Map
Nearby Homes
- 311 Willow St
- 309 Willow St
- 305 Willow St
- 310 Willow St
- 307 Willow St
- 303 Willow St
- 302 Willow St
- 306 Willow St
- 312 Willow St
- 304 Willow St
- 000 Xxx St
- 105 W Rippey Ave
- 213 Davenport Ave
- 117 W Amy St
- 410 S East Ave
- 11302 W 60th St N
- 5240 N 67th Ave W
- 0000 W 96th St N
- 6839 Center St
- 5323 Highway F36 W