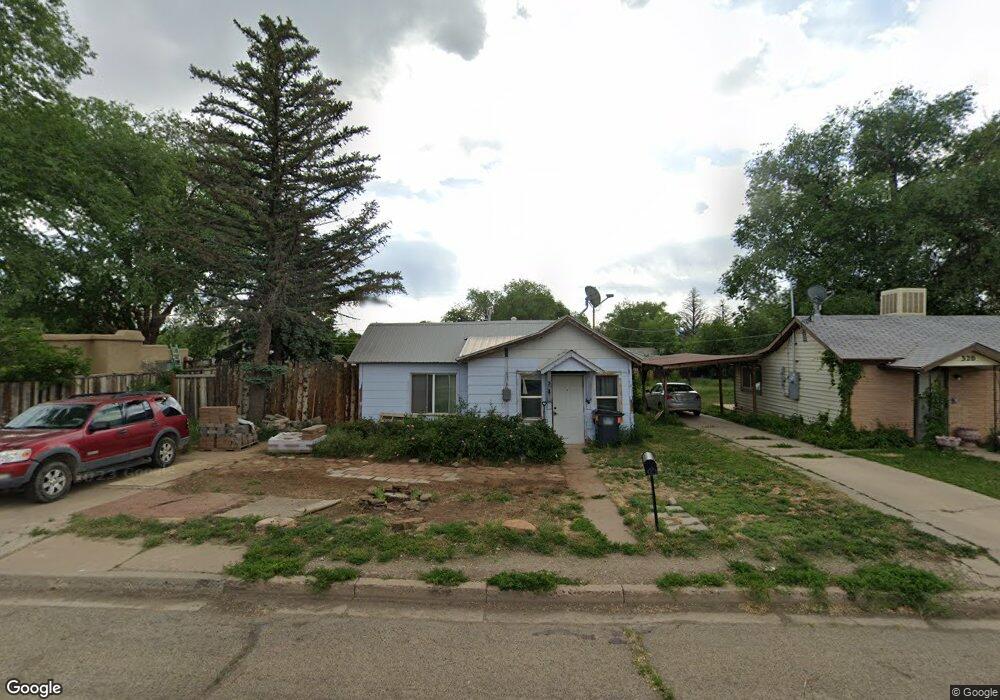
314 S Maple St Cortez, CO 81321
Estimated Value: $133,000 - $192,000
2
Beds
1
Bath
780
Sq Ft
$215/Sq Ft
Est. Value
About This Home
This home is located at 314 S Maple St, Cortez, CO 81321 and is currently estimated at $167,525, approximately $214 per square foot. 314 S Maple St is a home with nearby schools including Montezuma-Cortez High School, Children's Kiva Montessori School, and Children's Kiva Montessori Preschool & Kindergarten.
Ownership History
Date
Name
Owned For
Owner Type
Purchase Details
Closed on
Aug 19, 2005
Sold by
Davies Ginger R and Freeman Ginger
Bought by
Mckinney Cathryn
Current Estimated Value
Home Financials for this Owner
Home Financials are based on the most recent Mortgage that was taken out on this home.
Original Mortgage
$54,400
Outstanding Balance
$28,310
Interest Rate
5.81%
Mortgage Type
New Conventional
Estimated Equity
$139,215
Purchase Details
Closed on
Aug 10, 2005
Sold by
Wadripp Sandy
Bought by
Davis Ginger R and Freeman Ginger
Home Financials for this Owner
Home Financials are based on the most recent Mortgage that was taken out on this home.
Original Mortgage
$54,400
Outstanding Balance
$28,310
Interest Rate
5.81%
Mortgage Type
New Conventional
Estimated Equity
$139,215
Purchase Details
Closed on
Dec 1, 2003
Sold by
Wardrip Sandy
Bought by
Davies Ginger R
Purchase Details
Closed on
Nov 15, 2002
Sold by
Wardrip Sandy
Bought by
Wardrip Sandy
Purchase Details
Closed on
Nov 6, 2002
Sold by
Belt Alice Jane
Create a Home Valuation Report for This Property
The Home Valuation Report is an in-depth analysis detailing your home's value as well as a comparison with similar homes in the area
Purchase History
| Date | Buyer | Sale Price | Title Company |
|---|---|---|---|
| Mckinney Cathryn | $60,000 | None Available | |
| Davis Ginger R | -- | None Available | |
| Davies Ginger R | -- | -- | |
| Wardrip Sandy | -- | -- | |
| -- | -- | -- |
Source: Public Records
Mortgage History
| Date | Status | Borrower | Loan Amount |
|---|---|---|---|
| Open | Mckinney Cathryn | $54,400 | |
| Closed | Davis Ginger R | $54,400 |
Source: Public Records
Tax History
| Year | Tax Paid | Tax Assessment Tax Assessment Total Assessment is a certain percentage of the fair market value that is determined by local assessors to be the total taxable value of land and additions on the property. | Land | Improvement |
|---|---|---|---|---|
| 2024 | $515 | $5,134 | $1,336 | $3,798 |
| 2023 | $264 | $9,512 | $2,475 | $7,037 |
| 2022 | $294 | $6,069 | $1,130 | $4,939 |
| 2021 | $299 | $6,069 | $1,130 | $4,939 |
| 2020 | $274 | $5,775 | $1,243 | $4,532 |
| 2019 | $274 | $5,775 | $1,243 | $4,532 |
| 2018 | $317 | $4,980 | $1,120 | $3,860 |
| 2017 | $316 | $4,980 | $1,120 | $3,860 |
| 2016 | $285 | $4,960 | $1,240 | $3,720 |
| 2015 | $262 | $72,280 | $0 | $0 |
| 2014 | $305 | $4,960 | $0 | $0 |
Source: Public Records
Map
Nearby Homes
- 420 W 4th St
- 210 W 3rd St Unit 4
- 317 S Chestnut St
- 209 S Chestnut St
- 520 W 6th St Unit 15
- 501 S Market St
- 144 S Market St
- 500 S Market St
- 313 S Broadway
- 706 S Cedar St
- 431 Juniper Place
- 526 Juniper Place
- 511 Juniper Place
- 530 Juniper Place
- 821 S Chestnut St
- 122 E 1st St Unit see broker remarks
- 770 Stratton Dr
- 16 W 10th St
- 608 Alameda Dr
- Tract 9 N Broadway
- 320 S Maple St
- 300 S Maple St
- 326 S Maple St
- TBD W 3rd St
- 334 S Maple St
- S Maple Unit 407 S Maple
- S Maple
- 307 W 3rd St
- 311 S Maple St
- 301 S Maple St
- 346 S Maple St
- 240 S Maple St
- 333 S Linden St
- 325 S Maple St
- 331 S Maple St
- 307 S Linden St
- 347 S Maple St
- 236 S Maple St
- 335 S Linden St
- 247 S Linden St
Your Personal Tour Guide
Ask me questions while you tour the home.