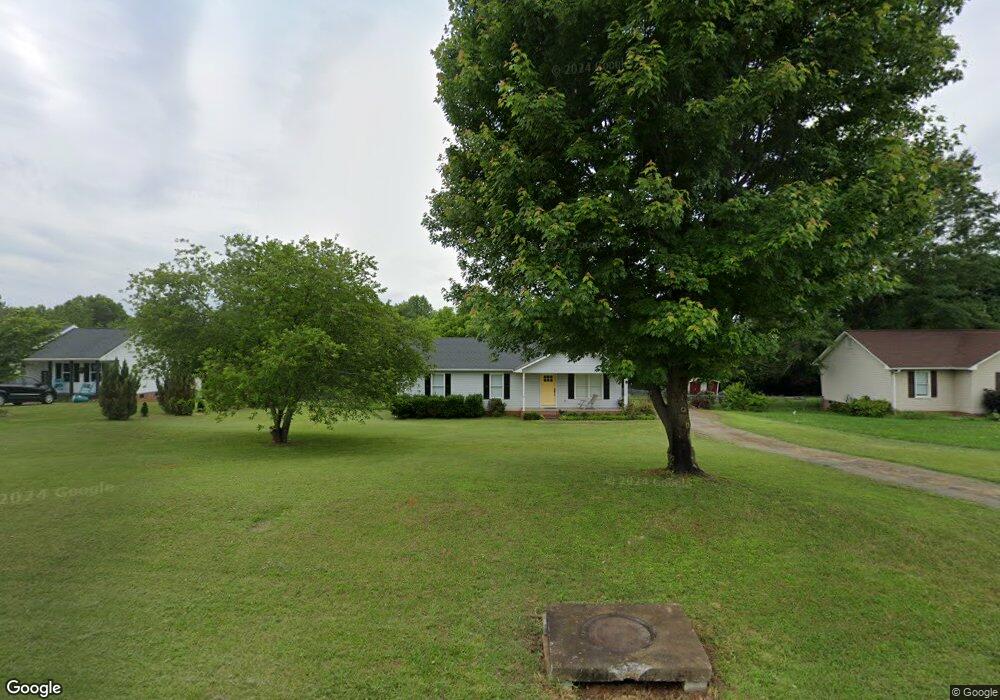
314 Salters Ct Chesnee, SC 29323
Estimated Value: $221,510 - $244,000
3
Beds
2
Baths
1,127
Sq Ft
$207/Sq Ft
Est. Value
About This Home
This home is located at 314 Salters Ct, Chesnee, SC 29323 and is currently estimated at $233,128, approximately $206 per square foot. 314 Salters Ct is a home located in Spartanburg County with nearby schools including Cooley Springs-Fingerville Elementary School, Chesnee Middle School, and Chesnee High School.
Ownership History
Date
Name
Owned For
Owner Type
Purchase Details
Closed on
Jun 20, 2019
Sold by
Ctc Consulting Llc
Bought by
Ward Baxter M
Current Estimated Value
Home Financials for this Owner
Home Financials are based on the most recent Mortgage that was taken out on this home.
Original Mortgage
$106,400
Outstanding Balance
$93,362
Interest Rate
4%
Mortgage Type
New Conventional
Estimated Equity
$139,766
Purchase Details
Closed on
Mar 5, 2019
Sold by
Brognano Alexandra and Fortunato Nicollette J
Bought by
Ctc Consulting Llc
Purchase Details
Closed on
Oct 31, 2006
Sold by
Boyd William Travis
Bought by
Brognano Denise
Home Financials for this Owner
Home Financials are based on the most recent Mortgage that was taken out on this home.
Original Mortgage
$78,100
Interest Rate
6.31%
Mortgage Type
New Conventional
Purchase Details
Closed on
Aug 11, 2004
Sold by
Boyd Kerry A
Bought by
Boyd William Travis
Create a Home Valuation Report for This Property
The Home Valuation Report is an in-depth analysis detailing your home's value as well as a comparison with similar homes in the area
Home Values in the Area
Average Home Value in this Area
Purchase History
| Date | Buyer | Sale Price | Title Company |
|---|---|---|---|
| Ward Baxter M | $133,000 | None Available | |
| Ctc Consulting Llc | $89,000 | None Available | |
| Brognano Denise | $86,000 | None Available | |
| Boyd William Travis | -- | -- |
Source: Public Records
Mortgage History
| Date | Status | Borrower | Loan Amount |
|---|---|---|---|
| Open | Ward Baxter M | $106,400 | |
| Previous Owner | Brognano Denise | $78,100 |
Source: Public Records
Tax History Compared to Growth
Tax History
| Year | Tax Paid | Tax Assessment Tax Assessment Total Assessment is a certain percentage of the fair market value that is determined by local assessors to be the total taxable value of land and additions on the property. | Land | Improvement |
|---|---|---|---|---|
| 2025 | $966 | $5,840 | $804 | $5,036 |
| 2024 | $966 | $5,840 | $804 | $5,036 |
| 2023 | $966 | $5,840 | $804 | $5,036 |
| 2022 | $914 | $5,320 | $540 | $4,780 |
| 2021 | $914 | $5,320 | $540 | $4,780 |
| 2020 | $896 | $5,320 | $540 | $4,780 |
| 2019 | $648 | $3,753 | $513 | $3,240 |
| 2018 | $633 | $3,753 | $513 | $3,240 |
| 2017 | $564 | $3,264 | $540 | $2,724 |
| 2016 | $564 | $3,264 | $540 | $2,724 |
| 2015 | $559 | $3,264 | $540 | $2,724 |
| 2014 | $554 | $3,264 | $540 | $2,724 |
Source: Public Records
Map
Nearby Homes
- 318 Salters Ct
- 310 Salters Ct
- 322 Salters Ct
- 309 Salters Ct
- 2845 Fairfield Rd
- 2855 Fairfield Rd
- 317 Salters Ct
- 326 Salters Ct
- 325 Salters Ct
- 2815 Fairfield Rd
- 321 Salters Ct
- 2805 Fairfield Rd
- 2777 Fairfield Rd
- 2979 Fairfield Rd
- 2785 Fairfield Rd
- 855 Martin Camp Rd
- 3015 Fairfield Rd
- 949 Martin Camp Rd
- 2715 Fairfield Rd
- 184 Sulphur Springs Rd