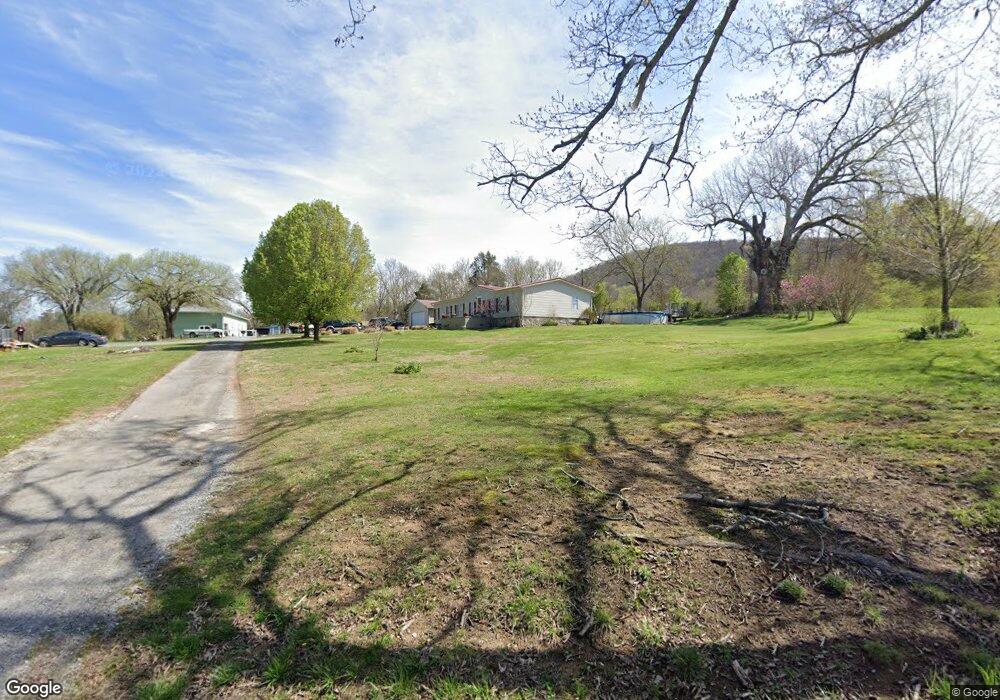
314 Sharp Rd Sevierville, TN 37876
Estimated Value: $262,000 - $312,556
Studio
2
Baths
1,792
Sq Ft
$160/Sq Ft
Est. Value
About This Home
This home is located at 314 Sharp Rd, Sevierville, TN 37876 and is currently estimated at $287,278, approximately $160 per square foot. 314 Sharp Rd is a home located in Sevier County with nearby schools including New Center Christian School.
Ownership History
Date
Name
Owned For
Owner Type
Purchase Details
Closed on
Apr 18, 2010
Sold by
Morton Ralph E
Bought by
Owens Patricia and Owens Earl
Current Estimated Value
Home Financials for this Owner
Home Financials are based on the most recent Mortgage that was taken out on this home.
Original Mortgage
$66,400
Interest Rate
4.74%
Mortgage Type
Commercial
Purchase Details
Closed on
Feb 10, 2006
Sold by
Federal National Mortgage Association
Bought by
Morton Ralph E
Purchase Details
Closed on
May 19, 2005
Bought by
Mortgage Electronic Reg System %Federal Natl
Purchase Details
Closed on
Aug 26, 2003
Sold by
Jean Herron Barbara
Bought by
Edward Herron Roy
Purchase Details
Closed on
Nov 27, 2001
Sold by
Michael Williams Loren
Bought by
Eddie Herron Roy
Purchase Details
Closed on
May 26, 2000
Sold by
Williams Loren M
Bought by
Etal Herron Roy E
Create a Home Valuation Report for This Property
The Home Valuation Report is an in-depth analysis detailing your home's value as well as a comparison with similar homes in the area
Home Values in the Area
Average Home Value in this Area
Purchase History
| Date | Buyer | Sale Price | Title Company |
|---|---|---|---|
| Owens Patricia | $71,750 | -- | |
| Morton Ralph E | $88,750 | -- | |
| Mortgage Electronic Reg System %Federal Natl | $85,100 | -- | |
| Edward Herron Roy | -- | -- | |
| Eddie Herron Roy | $66,900 | -- | |
| Etal Herron Roy E | $88,000 | -- |
Source: Public Records
Mortgage History
| Date | Status | Borrower | Loan Amount |
|---|---|---|---|
| Previous Owner | Owens Patricia | $66,400 |
Source: Public Records
Tax History
| Year | Tax Paid | Tax Assessment Tax Assessment Total Assessment is a certain percentage of the fair market value that is determined by local assessors to be the total taxable value of land and additions on the property. | Land | Improvement |
|---|---|---|---|---|
| 2025 | $324 | $21,925 | $5,625 | $16,300 |
| 2024 | $324 | $21,925 | $5,625 | $16,300 |
| 2023 | $324 | $21,925 | $0 | $0 |
| 2022 | $324 | $21,925 | $5,625 | $16,300 |
| 2021 | $324 | $21,925 | $5,625 | $16,300 |
| 2020 | $379 | $21,925 | $5,625 | $16,300 |
| 2019 | $379 | $20,375 | $5,875 | $14,500 |
| 2018 | $379 | $20,375 | $5,875 | $14,500 |
| 2017 | $379 | $20,375 | $5,875 | $14,500 |
| 2016 | $379 | $20,375 | $5,875 | $14,500 |
| 2015 | -- | $21,875 | $0 | $0 |
| 2014 | $357 | $21,874 | $0 | $0 |
Source: Public Records
Map
Nearby Homes
- 000 Flat Creek Rd
- Lot 5 Dalton Dr
- 2811 Dalton Dr
- 427 Eledge Farm Rd
- 3211 Old Newport Hwy
- 328 Hansels Lea
- 229 Dove Dr
- 3218 Old Newport Hwy
- 2875 E Walnut Grove Rd
- 635 Sharp Rd
- 637 Sharp Rd
- 431 Thomas Loop Rd
- 1098 Cummings Chapel Rd
- 3101 Amanda View Way
- 1121 Cummings Chapel Rd
- 149 Fairgarden Rd
- 115 Heritage Ln
- 0 Sharp Rd Unit LotWP001 18699643
- 0 Sharp Rd Unit 1324313
- 0 Cummings Chapel Rd Unit 1301411
- 310 Sharp Rd
- 302 Sharp Rd
- 3021 Old Newport Hwy
- Tr. 13 Sharp Rd
- TR 11 Sharp Rd
- Tract 1A Lillard Allen Ln
- 2997 Old Newport Hwy
- 3038 Old Newport Hwy
- 2996 Old Newport Hwy
- 352 Lillard Allen Ln
- 402 Kelly Hills Rd
- 2992 Old Newport Hwy
- 3051 Old Newport Hwy
- 360 Lillard Allen Ln
- 2985 Old Newport Hwy
- 3050 Old Newport Hwy
- 360 Sharp Rd
- 3069 Old Newport Hwy
- 412 Kelly Hills Rd
- 3061 Old Newport Hwy
Your Personal Tour Guide
Ask me questions while you tour the home.