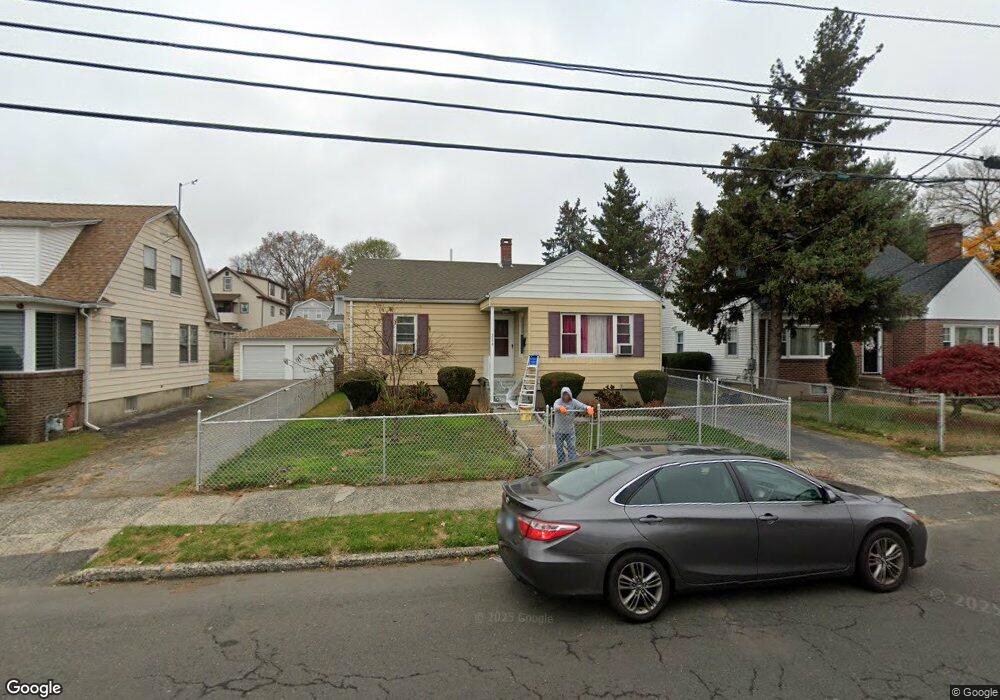
314 Thorme St Bridgeport, CT 06606
North End NeighborhoodEstimated Value: $379,000 - $419,000
2
Beds
2
Baths
1,082
Sq Ft
$374/Sq Ft
Est. Value
About This Home
This home is located at 314 Thorme St, Bridgeport, CT 06606 and is currently estimated at $404,331, approximately $373 per square foot. 314 Thorme St is a home located in Fairfield County with nearby schools including Blackham School, Central High School, and Northeastern Adventist Academy - Fairfield County.
Ownership History
Date
Name
Owned For
Owner Type
Purchase Details
Closed on
Jan 20, 2010
Sold by
Pereira Domingos Est
Bought by
Brewster Pamela
Current Estimated Value
Home Financials for this Owner
Home Financials are based on the most recent Mortgage that was taken out on this home.
Original Mortgage
$141,432
Outstanding Balance
$92,101
Interest Rate
4.79%
Estimated Equity
$312,230
Purchase Details
Closed on
Dec 23, 2004
Sold by
Lashley Larie
Bought by
Pereira Domingos
Purchase Details
Closed on
May 12, 2000
Sold by
Healy Edward A
Bought by
Lashley Laurie A
Home Financials for this Owner
Home Financials are based on the most recent Mortgage that was taken out on this home.
Original Mortgage
$107,950
Interest Rate
8.21%
Purchase Details
Closed on
Mar 19, 1992
Sold by
Papamichail H and Papamichail Papmihail D
Bought by
Healy Edward and Healy Robin
Create a Home Valuation Report for This Property
The Home Valuation Report is an in-depth analysis detailing your home's value as well as a comparison with similar homes in the area
Home Values in the Area
Average Home Value in this Area
Purchase History
| Date | Buyer | Sale Price | Title Company |
|---|---|---|---|
| Brewster Pamela | $149,000 | -- | |
| Brewster Pamela | $149,000 | -- | |
| Pereira Domingos | $195,000 | -- | |
| Pereira Domingos | $195,000 | -- | |
| Lashley Laurie A | $127,000 | -- | |
| Lashley Laurie A | $127,000 | -- | |
| Healy Edward | $100,000 | -- | |
| Healy Edward | $100,000 | -- |
Source: Public Records
Mortgage History
| Date | Status | Borrower | Loan Amount |
|---|---|---|---|
| Open | Healy Edward | $141,432 | |
| Closed | Healy Edward | $141,432 | |
| Previous Owner | Healy Edward | $107,950 |
Source: Public Records
Tax History Compared to Growth
Tax History
| Year | Tax Paid | Tax Assessment Tax Assessment Total Assessment is a certain percentage of the fair market value that is determined by local assessors to be the total taxable value of land and additions on the property. | Land | Improvement |
|---|---|---|---|---|
| 2025 | $6,966 | $160,330 | $75,310 | $85,020 |
| 2024 | $6,966 | $160,330 | $75,310 | $85,020 |
| 2023 | $6,966 | $160,330 | $75,310 | $85,020 |
| 2022 | $6,966 | $160,330 | $75,310 | $85,020 |
| 2021 | $6,966 | $160,330 | $75,310 | $85,020 |
| 2020 | $6,029 | $111,660 | $43,270 | $68,390 |
| 2019 | $6,029 | $111,660 | $43,270 | $68,390 |
| 2018 | $6,071 | $111,660 | $43,270 | $68,390 |
| 2017 | $6,071 | $111,660 | $43,270 | $68,390 |
| 2016 | $6,071 | $111,660 | $43,270 | $68,390 |
| 2015 | $5,746 | $136,150 | $49,980 | $86,170 |
| 2014 | $5,746 | $136,150 | $49,980 | $86,170 |
Source: Public Records
Map
Nearby Homes
- 260 Birmingham St
- 113 Clark St
- 214 Burnsford Ave
- 184 Merritt St
- 3401 Main St
- 234 Savoy St
- 376 Savoy St
- 604 Birmingham St
- 339 Goldenrod Ave
- 1095 Wayne St
- 354 Beechmont Ave
- 520 Savoy St
- 375 Ruth St
- 485 Westfield Ave
- 631 Fairview Ave
- 605 Merritt St
- 45 Stevens St Unit 2
- 105 Tremont Ave Unit E
- 105 Tremont Ave Unit B
- 1265 Lindley St