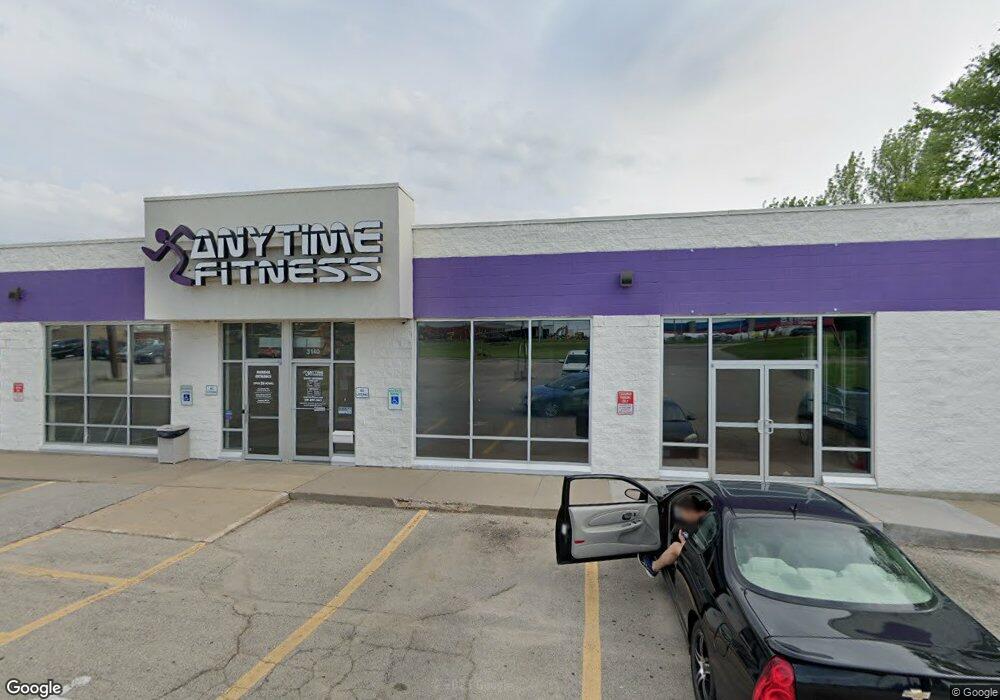
3140 16th Ave SW Cedar Rapids, IA 52404
Estimated Value: $1,046,378
--
Bed
--
Bath
7,620
Sq Ft
$137/Sq Ft
Est. Value
About This Home
This home is located at 3140 16th Ave SW, Cedar Rapids, IA 52404 and is currently estimated at $1,046,378, approximately $137 per square foot. 3140 16th Ave SW is a home located in Linn County with nearby schools including Junction City Elementary School, Cleveland Elementary School, and Kentucky Tech - Ashland Reg Tech Center.
Ownership History
Date
Name
Owned For
Owner Type
Purchase Details
Closed on
Jan 19, 2022
Sold by
V & T Properties Llc
Bought by
Ci Property Llc
Current Estimated Value
Home Financials for this Owner
Home Financials are based on the most recent Mortgage that was taken out on this home.
Original Mortgage
$671,500
Outstanding Balance
$618,871
Interest Rate
3.11%
Mortgage Type
New Conventional
Estimated Equity
$427,507
Purchase Details
Closed on
Jan 3, 2014
Sold by
Chipokas Properties Lc
Bought by
V & T Properties Llc
Home Financials for this Owner
Home Financials are based on the most recent Mortgage that was taken out on this home.
Original Mortgage
$502,500
Interest Rate
4.31%
Mortgage Type
Commercial
Purchase Details
Closed on
May 7, 1999
Sold by
Neighbor Morris F and Neighbor Betty L
Bought by
Berner Donald L and Berner Martha J
Create a Home Valuation Report for This Property
The Home Valuation Report is an in-depth analysis detailing your home's value as well as a comparison with similar homes in the area
Home Values in the Area
Average Home Value in this Area
Purchase History
| Date | Buyer | Sale Price | Title Company |
|---|---|---|---|
| Ci Property Llc | $850,000 | Elderkin & Pirnie Plc | |
| V & T Properties Llc | $546,750 | None Available | |
| Chipokas Properties Lc | -- | None Available | |
| Berner Donald L | -- | -- |
Source: Public Records
Mortgage History
| Date | Status | Borrower | Loan Amount |
|---|---|---|---|
| Open | Ci Property Llc | $671,500 | |
| Previous Owner | Chipokas Properties Lc | $502,500 |
Source: Public Records
Tax History Compared to Growth
Tax History
| Year | Tax Paid | Tax Assessment Tax Assessment Total Assessment is a certain percentage of the fair market value that is determined by local assessors to be the total taxable value of land and additions on the property. | Land | Improvement |
|---|---|---|---|---|
| 2025 | $22,970 | $780,500 | $160,800 | $619,700 |
| 2024 | $20,788 | $741,100 | $160,800 | $580,300 |
| 2023 | $20,788 | $741,100 | $160,800 | $580,300 |
| 2022 | $20,114 | $657,400 | $160,800 | $496,600 |
| 2021 | $20,978 | $1,172,200 | $160,800 | $1,011,400 |
| 2020 | $20,978 | $1,206,200 | $160,800 | $1,045,400 |
| 2019 | $20,142 | $683,500 | $160,800 | $522,700 |
| 2018 | $20,050 | $683,500 | $160,800 | $522,700 |
| 2017 | $20,050 | $588,200 | $160,800 | $427,400 |
| 2016 | $16,691 | $485,300 | $160,800 | $324,500 |
| 2015 | $16,978 | $494,093 | $160,775 | $333,318 |
| 2014 | $14,572 | $494,093 | $160,775 | $333,318 |
| 2013 | $17,042 | $494,093 | $160,775 | $333,318 |
Source: Public Records
Map
Nearby Homes
- 3109 12th Ave SW
- 3403 1st Ave SW
- 3701 16th Ave SW Unit 47
- 3724 2nd Ave SW
- 3150 Wilson Ave SW Unit H10
- 3150 Wilson Ave SW Unit 7
- 3140 Wilson Ave SW Unit 6
- 3013 Sue Ln NW
- 4101 16th Ave SW Unit 64A
- 2437 9th Ave SW
- 3416 Sue Ln NW
- 2178 Chandler St SW
- 2404 25th St SW
- 3918 21st Avenue Place SW
- 2433 8th Ave SW
- 3212 Wilson Ave SW
- 3000 Wilson Ave SW Unit A11
- 3000 Wilson Ave SW
- 56 Julia Ann Dr NW
- Remington - Cedar Rapids Plan at Whispering Pines
- 3200 16th Ave SW Unit 10
- 3200 16th Ave SW Unit F
- 3200 16th Ave SW Unit A
- 3200 16th Ave SW
- 3125 12th Ave SW
- 3207 12th Ave SW
- 3101 12th Ave SW
- 3145 16th Ave SW
- 3215 12th Ave SW
- 3225 12th Ave SW
- 3221 16th Ave SW
- 3221 16th Ave SW
- 3223 16th Ave SW
- 3223 16th Ave SW
- 419 La Salle Dr SW
- 424 31st St SW
- 409 La Salle Dr SW
- 3120 12th Ave SW
- 3200 12th Ave SW
- 418 31st St SW