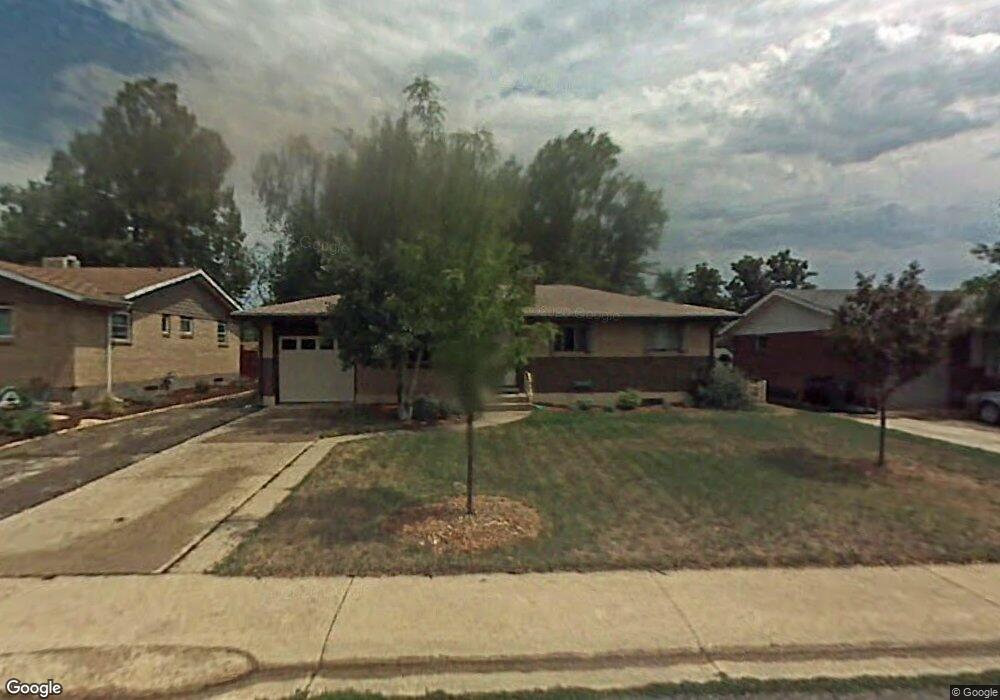
3140 23rd St Boulder, CO 80304
Central Boulder NeighborhoodEstimated Value: $986,595 - $1,287,000
4
Beds
2
Baths
1,892
Sq Ft
$598/Sq Ft
Est. Value
About This Home
This home is located at 3140 23rd St, Boulder, CO 80304 and is currently estimated at $1,130,649, approximately $597 per square foot. 3140 23rd St is a home located in Boulder County with nearby schools including Columbine Elementary School, Casey Middle School, and Boulder High School.
Ownership History
Date
Name
Owned For
Owner Type
Purchase Details
Closed on
Apr 23, 2009
Sold by
Cleary Sarah E and Dobbs Eric R
Bought by
Cleary Sarah E
Current Estimated Value
Purchase Details
Closed on
Mar 30, 2004
Sold by
Cleveland Victor E
Bought by
Cleary Sarah E and Dobbs Eric R
Home Financials for this Owner
Home Financials are based on the most recent Mortgage that was taken out on this home.
Original Mortgage
$307,600
Outstanding Balance
$143,843
Interest Rate
5.57%
Mortgage Type
Purchase Money Mortgage
Estimated Equity
$986,806
Purchase Details
Closed on
May 30, 2003
Sold by
Joy Suzette Melody Fredricksen and Joy Maurice L
Bought by
Cleveland Victor E
Home Financials for this Owner
Home Financials are based on the most recent Mortgage that was taken out on this home.
Original Mortgage
$264,800
Interest Rate
5.37%
Mortgage Type
Purchase Money Mortgage
Purchase Details
Closed on
Oct 25, 1993
Sold by
Fredricksen Maurice L and Fredricksen Margaret J
Bought by
Fredricksen Maurice L
Create a Home Valuation Report for This Property
The Home Valuation Report is an in-depth analysis detailing your home's value as well as a comparison with similar homes in the area
Home Values in the Area
Average Home Value in this Area
Purchase History
| Date | Buyer | Sale Price | Title Company |
|---|---|---|---|
| Cleary Sarah E | -- | None Available | |
| Cleary Sarah E | $384,500 | Land Title | |
| Cleveland Victor E | $331,000 | Land Title | |
| Fredricksen Maurice L | -- | -- |
Source: Public Records
Mortgage History
| Date | Status | Borrower | Loan Amount |
|---|---|---|---|
| Open | Cleary Sarah E | $307,600 | |
| Previous Owner | Cleveland Victor E | $264,800 |
Source: Public Records
Tax History
| Year | Tax Paid | Tax Assessment Tax Assessment Total Assessment is a certain percentage of the fair market value that is determined by local assessors to be the total taxable value of land and additions on the property. | Land | Improvement |
|---|---|---|---|---|
| 2025 | $6,593 | $70,688 | $55,000 | $15,688 |
| 2024 | $6,593 | $70,688 | $55,000 | $15,688 |
| 2023 | $6,479 | $75,020 | $58,243 | $20,462 |
| 2022 | $5,546 | $59,722 | $43,959 | $15,763 |
| 2021 | $5,288 | $61,440 | $45,224 | $16,216 |
| 2020 | $4,614 | $53,003 | $42,400 | $10,603 |
| 2019 | $4,543 | $53,003 | $42,400 | $10,603 |
| 2018 | $4,032 | $46,505 | $36,000 | $10,505 |
| 2017 | $3,906 | $51,414 | $39,800 | $11,614 |
| 2016 | $3,703 | $42,777 | $34,228 | $8,549 |
| 2015 | $3,507 | $36,545 | $18,149 | $18,396 |
| 2014 | $3,073 | $36,545 | $18,149 | $18,396 |
Source: Public Records
Map
Nearby Homes
- 3055 23rd St
- 3145 Fremont St
- 2410 Grape Ave
- 2901 Lorraine Ct
- 2595 Glenwood Dr
- 2991 25th St
- 2435 Hawthorn Ave
- 3150 19th St
- 3225 Arnett St
- 2025 Hermosa Dr
- 3275 19th St
- 2727 Folsom St Unit 303
- 2727 Folsom St Unit 115
- 2540 Iris Ave
- 2085 Balsam Dr
- 2707 Valmont Rd Unit D-304
- 2707 Valmont Rd Unit 106 Bonus!
- 2707 Valmont Rd Unit 311A
- 2525 Balsam Dr
- 3120 Eastwood Ct
Your Personal Tour Guide
Ask me questions while you tour the home.