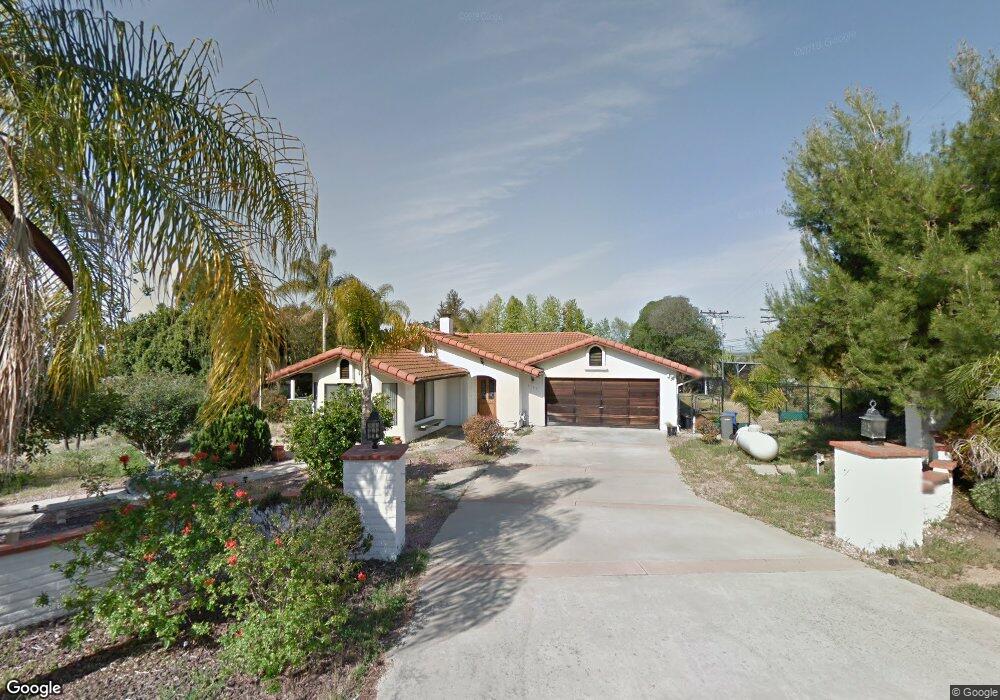
3141 Los Verdes Dr Fallbrook, CA 92028
Estimated Value: $871,000 - $963,000
3
Beds
2
Baths
2,020
Sq Ft
$457/Sq Ft
Est. Value
About This Home
This home is located at 3141 Los Verdes Dr, Fallbrook, CA 92028 and is currently estimated at $922,603, approximately $456 per square foot. 3141 Los Verdes Dr is a home located in San Diego County with nearby schools including La Paloma Elementary School, James E. Potter Intermediate School, and Fallbrook High School.
Ownership History
Date
Name
Owned For
Owner Type
Purchase Details
Closed on
Feb 12, 2019
Sold by
Obemacha Richard
Bought by
Obemacha Richard
Current Estimated Value
Purchase Details
Closed on
Nov 5, 1986
Bought by
Obemacha Richard Frances
Create a Home Valuation Report for This Property
The Home Valuation Report is an in-depth analysis detailing your home's value as well as a comparison with similar homes in the area
Home Values in the Area
Average Home Value in this Area
Purchase History
| Date | Buyer | Sale Price | Title Company |
|---|---|---|---|
| Obemacha Richard | -- | None Available | |
| Obemacha Richard Frances | $55,000 | -- |
Source: Public Records
Tax History
| Year | Tax Paid | Tax Assessment Tax Assessment Total Assessment is a certain percentage of the fair market value that is determined by local assessors to be the total taxable value of land and additions on the property. | Land | Improvement |
|---|---|---|---|---|
| 2025 | $3,003 | $290,320 | $113,102 | $177,218 |
| 2024 | $3,003 | $284,629 | $110,885 | $173,744 |
| 2023 | $2,922 | $279,049 | $108,711 | $170,338 |
| 2022 | $2,921 | $273,579 | $106,580 | $166,999 |
| 2021 | $2,827 | $268,216 | $104,491 | $163,725 |
| 2020 | $2,852 | $265,467 | $103,420 | $162,047 |
| 2019 | $2,797 | $260,263 | $101,393 | $158,870 |
| 2018 | $2,754 | $255,160 | $99,405 | $155,755 |
| 2017 | $2,699 | $250,157 | $97,456 | $152,701 |
| 2016 | $2,630 | $245,253 | $95,546 | $149,707 |
| 2015 | $2,581 | $241,570 | $94,111 | $147,459 |
| 2014 | $2,531 | $236,839 | $92,268 | $144,571 |
Source: Public Records
Map
Nearby Homes
- 3097 Green Heather Ln
- 3121 Alta Verde Dr
- 1761 Winterwarm Dr
- 3600 Linda Vista Dr
- 1650 Winterwarm Dr
- 1864 Winterwarm Dr
- 0 Sunset Grove Rd
- 2230 Calle Dos Lomas
- 2869 Dos Lomas Place
- 2975 Dos Lomas
- 1474 Via Encinos Dr
- 1195 Via Encinos Dr
- 3890 Forbell Place
- 1106 Big Oak Ranch Rd
- 2240 Aqua Hill Rd
- 1335 El Nido Dr
- 3670 Genista Place
- 1971 Candice Ct Unit 64
- 2328 Dos Lomas
- 2449 Trails End
- 3218 Alta Vista Dr
- 3180 Alta Vista Dr
- 3128 Los Verdes Dr
- 3220 Alta Vista Dr
- 0 Los Verdes Dr
- 3191 Los Verdes Dr
- 3180 Los Verdes Dr
- 3165 Alta Vista Dr
- 3144 Alta Verde Dr
- 3260 Alta Vista Dr
- 3150 Alta Vista Dr
- 3258 Alta Vista Dr
- 3203 Alta Vista Dr
- 3231 Los Verdes Dr
- 3172 Alta Verde Dr
- 3124 Alta Vista Dr
- 3104 Alta Vista Dr
- 3228 Los Verdes Dr
- 3272 Alta Vista Dr
- 3168 Alta Verde Dr
Your Personal Tour Guide
Ask me questions while you tour the home.