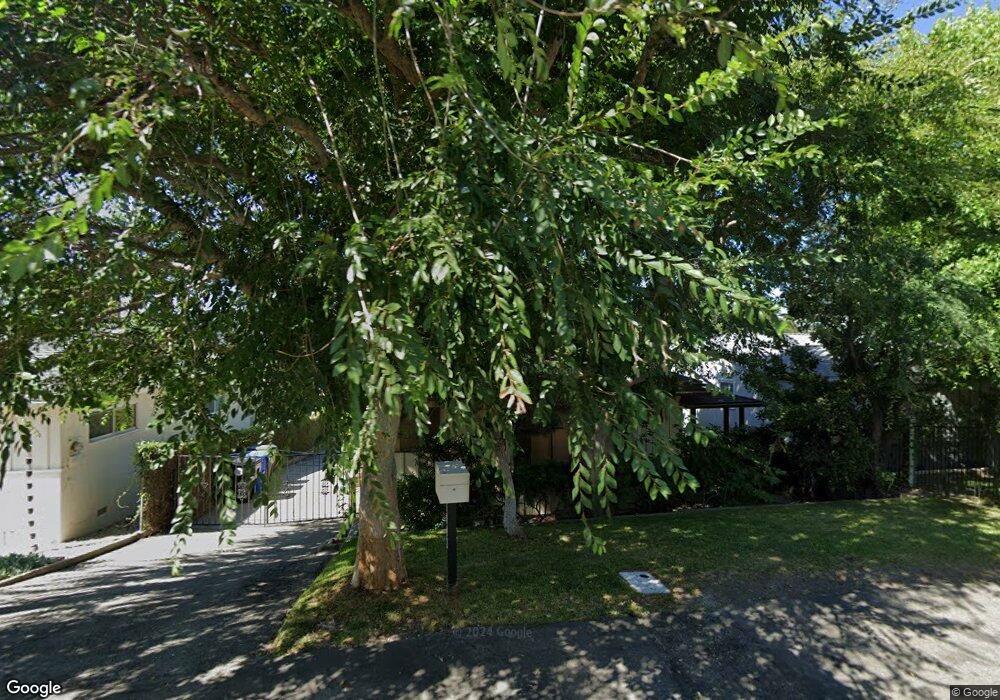
3142 Santa Carlotta St La Crescenta, CA 91214
Estimated Value: $984,771 - $1,294,000
2
Beds
1
Bath
1,065
Sq Ft
$1,087/Sq Ft
Est. Value
About This Home
This home is located at 3142 Santa Carlotta St, La Crescenta, CA 91214 and is currently estimated at $1,157,943, approximately $1,087 per square foot. 3142 Santa Carlotta St is a home located in Los Angeles County with nearby schools including Valley View Elementary School, Rosemont Middle School, and Crescenta Valley High School.
Ownership History
Date
Name
Owned For
Owner Type
Purchase Details
Closed on
Jul 5, 2018
Sold by
Rosenbaum Dennis S
Bought by
Rosenbaum Dennis and The Dennis Rosenbaum 2018 Revo
Current Estimated Value
Purchase Details
Closed on
Jul 3, 2004
Sold by
Rosenbaum Dennis S
Bought by
Rosenbaum Dennis S and The Dennis S Rosenbaum Trust
Purchase Details
Closed on
Jan 6, 2003
Sold by
Mckee Walter C
Bought by
Rosenbaum Dennis S
Home Financials for this Owner
Home Financials are based on the most recent Mortgage that was taken out on this home.
Original Mortgage
$265,000
Interest Rate
5.83%
Purchase Details
Closed on
May 5, 1997
Sold by
Edwards Stewart F Co Tr Edwards Trust
Bought by
Mckee Walter C
Home Financials for this Owner
Home Financials are based on the most recent Mortgage that was taken out on this home.
Original Mortgage
$142,400
Interest Rate
8.13%
Create a Home Valuation Report for This Property
The Home Valuation Report is an in-depth analysis detailing your home's value as well as a comparison with similar homes in the area
Home Values in the Area
Average Home Value in this Area
Purchase History
| Date | Buyer | Sale Price | Title Company |
|---|---|---|---|
| Rosenbaum Dennis | -- | None Available | |
| Rosenbaum Dennis S | -- | None Available | |
| Rosenbaum Dennis S | -- | -- | |
| Rosenbaum Dennis S | $365,000 | Chicago Title Co | |
| Mckee Walter C | $178,000 | -- |
Source: Public Records
Mortgage History
| Date | Status | Borrower | Loan Amount |
|---|---|---|---|
| Previous Owner | Rosenbaum Dennis S | $265,000 | |
| Previous Owner | Mckee Walter C | $142,400 |
Source: Public Records
Tax History Compared to Growth
Tax History
| Year | Tax Paid | Tax Assessment Tax Assessment Total Assessment is a certain percentage of the fair market value that is determined by local assessors to be the total taxable value of land and additions on the property. | Land | Improvement |
|---|---|---|---|---|
| 2025 | $6,306 | $546,865 | $422,905 | $123,960 |
| 2024 | $6,306 | $536,143 | $414,613 | $121,530 |
| 2023 | $6,168 | $525,632 | $406,484 | $119,148 |
| 2022 | $5,868 | $515,326 | $398,514 | $116,812 |
| 2021 | $5,767 | $505,222 | $390,700 | $114,522 |
| 2019 | $5,548 | $490,238 | $379,112 | $111,126 |
| 2018 | $5,444 | $480,627 | $371,679 | $108,948 |
| 2016 | $5,193 | $461,966 | $357,248 | $104,718 |
| 2015 | $5,080 | $455,028 | $351,882 | $103,146 |
| 2014 | $5,041 | $446,116 | $344,990 | $101,126 |
Source: Public Records
Map
Nearby Homes
- 4827 Pennsylvania Ave
- 3129 Orange Ave
- 3023 El Caminito
- 3015 Henrietta Ave
- 3052 Alabama St
- 4738 New York Ave
- 3040 Gertrude Ave
- 3332 Santa Carlotta St
- 4520 Pennsylvania Ave Unit 120
- 2800 Henrietta Ave
- 3117 Harmony Place
- 2767 Brookhill St
- 3330 Henrietta Ave
- 3427 Paraiso Way
- 2861 Markridge Rd
- 3541 Mary Ann St
- 4530 Ramsdell Ave Unit 11
- 3058 Cloudcrest Rd
- 4357 Pennsylvania Ave
- 3346 Altura Ave
- 3140 Santa Carlotta St
- 3148 Santa Carlotta St
- 3136 Santa Carlotta St
- 3159 El Caminito
- 3141 Santa Carlotta St
- 3137 Santa Carlotta St
- 3147 Santa Carlotta St
- 3153 El Caminito
- 4842 Pennsylvania Ave
- 3128 Santa Carlotta St
- 4836 Pennsylvania Ave
- 3133 Santa Carlotta St
- 3151 El Caminito
- 4850 Pennsylvania Ave
- 3151 Santa Carlotta St
- 3149 El Caminito
- 3129 Santa Carlotta St
- 3126 Santa Carlotta St
- 4900 Pennsylvania Ave
- 3145 El Caminito